

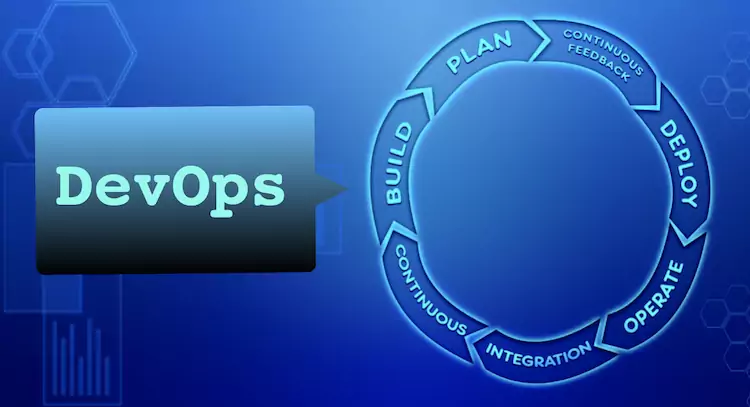
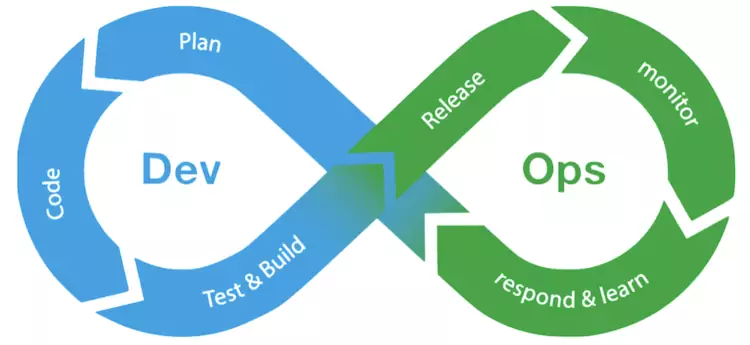
DevOps engineers employ a set of tools for IT operations and IT development integration for automating more of the lifecycle development processes.
Their goal is to overcome the challenges facing development teams in delivering high-quality software.
DevOps engineers are involved in the entire product lifecycle – from ideation to product delivery. This requires several tasks, many of which can be automated.
Choosing the right tools to optimize DevOps practices, including the use of automation as much as possible, is crucial for long-term viability of the business. Automating manual tasks enables engineers to focus their attention on the most challenging tasks.
The Top 9 DevOps Monitoring Tools to Consider in 2022
DevOps require monitoring tools to keep a close eye on applications, servers, and networks. These tools monitor system performance and security. Continuous monitoring tools help DevOps teams accelerate their incident response times.
Insightful monitoring makes it possible to simulate real-world user environments on digital assets. This makes it easier to learn about potential issues before they’re deployed to production.
Here is a list of the top 9 monitoring tools used by DevOps today.
1. Librato
Librato is a real-time cloud-monitoring tool that offers full-stack solution tracking and analytics. including granular visualization, analysis, and alert notifications.
Librato allows users to collect all the critical data in one hosted environment with early detection of potential issues. Such a procedure prevents harmful impact on the business processes and cures errors fast and efficiently. Librato can operate real-time data from various sources. Librato has revolutionized the genius of real-time monitoring and metrics collecting from AWS, Heroku, Collectd, or AppHarbor.
Librato’s functional DSL program supports major metrics aggregation and transformation that can be compared and placed in creative dashboards. Wiring up Turn-Key Integrations offers a fully-populated dashboard in about 5 minutes ( starting from zero visibility). Also, functional DSL can use math transforms to any version of users’ time sequences, either splitting data into ratios or uniting it into a single composition, depending on the issues.
Major features:
- Quick reaction to abnormal activity
- Rapid root-cause examination
- High resolution and features correlation solution
- Multiple sources for data collection
- Easy integration procedures
- Flexible monitoring approaches
- SaaS deployment model
2. Nagios
Nagios is one more representative of the open-source continuous DevOps tools. Exactly like its other monitoring “colleagues” Nagios feels danger, alerts the user, and rapidly fixes the issue. This is in a nutshell.
Here are three products to be considered for monitoring purposes:
Nagios Fusion
It is possible to achieve top-level visibility and scalability with Nagios Fusion for your network, solving issues that stem from numerous networks and geo separations.
Nagios Log Server
This Nagios product makes it easy to search for the log data. Basically, users can have all their log data stored in the environment, with a high degree of availability and failover developed right in.
Nagios XI
This monitoring tool controls critical components of the system infrastructure ( apps, services, OS, protocols, metrics, and network infrastructures).
Major features:
Network monitoring – monitoring of issues caused by overloaded data links or network connections; availability, uptime, and node response time monitoring; results delivery in a diversity of visual representations.
Server monitoring – agent-based and agentless servers control; 5000 various addons for servers monitoring.
Apps monitoring – rapid issue detection; reduces downtime for app users; functions perfectly for both applications and applications state.
3. Splunk
DevOps teams use Splunk for its speed, quality, and ability to support the entire business. Splunk enables real-time improvements throughout the delivery lifecycle.
Splunk proves itself to be a tool for quite a strategic partnership when it comes to performing operations in the cloud environment. The Splunk tool is an integral cog in the bridge between the development cycle and the final exploitation experience, providing all the essential information on how the product may be improved in order to establish a friendly user experience. This makes it possible to innovate and upgrade in the shortest terms.
Major features
- Cloud Foundations
- Connected experiences
- Dashboards and visualization
- Monitoring and alerting
- Reporting
- Metrics
- Machine learning toolkit
- Scale and manageability
- Support and Services
- Integrations
Also, Splunk promises real-time analytics, and troubleshooting potential for the “in-house” infrastructure, cloud one, or for the combined environments. Its multifunctionality and ability to monitor automation in one place contributed to almost 13,000 satisfied users and more than 200 successful integrations for support and personalization.
4. AppDynamics
AppDynamics is a continuous monitoring tool that guarantees flawless traceability, and according to the positive reviews of its users, and bridges advanced power management together with business product usage efficiently.
It controls infrastructure, networks, and apps being both on-prem and cloud computing locations. DevOps can collect critical information from basically any participation unit ( database components, end-user sessions, apps, infrastructure components, etc). This way they support visibility on a highly manageable level so that to catch the attack and react quickly without a major pause in the business workflow.
AppDynamics connects teams around one common goal: to keep the business processes flowing uninterrupted. The options it provides for thorough monitoring and fast irregular events detection allow fewer deliberations and contribute to yielding exceptional outcomes.
Major features:
- Multiple platforms support ( MS Azure, AWS, IBM)
- Machine learning for an immediate root cause analysis
- Easy hybrid environment monitoring
- Real-time functional insights delivery
5. PagerDuty
PagerDuty is cloud solutions function execution platform that allows users to adopt the best DevOps practices to improve existing experiences instead of radically replacing everything.
PagerDuty for DevOps comes with the following sets of products:
PagerDuty Incident Response – maintains a good image in terms of the customer experience through speedy critical incidents resolution; guarantees automation of the end-to-end incident responses
PagerDuty on-call – distribution of on-call responsibilities throughout teams; assurance of the exact people being notified at the exactly correct timing due to the product’s flexible organizations and escalations
PagerDuty Automation Actions – easy connection within the production infrastructure; curation and delegation of existing tasks in regards to incidents
PagerDuty Runbook Automation – SaaS runbook automation platform for self-services IT infrastructure and integration with other SaaS and cloud tools
DevOps products of PagerDuty allow the user to ingest monitored essential data, customer service tools, and ITSM. By making machines sort of the first line of defense, PagerDuty saves the responders’ energy and time. PagerDuty groups alerts into incidents, solely sending the most relevant to teams to work on.
Major features:
- Integration of monitoring systems, customer support, API, and performance management.
- Possibility to connect various monitoring and log management tools ( with the potential to send emails or start REST calls).
- In-depth data compilation
- Incident response simplification
Also See: DNSMONSTER- Passive DNS Capture/Monitoring Framework
6. Kibana
Kibana is a free and open-frontend app that was created to provide search and visualize data that is indexed in Elasticsearch. Kibana is designed as the user interface that monitors, manages, and secures Elastic Stack clusters, and is also known to be the centralized spot for built-in solutions developed on Elastic stack.
Kibana simplifies complicated data analysis and its visual representation by employing charts, maps, and tables. Its interface permits users to query data in Elasticsearch indices. After, its visualization is possible by the means of standardized chart options or built-in applications ( Maps, Canva, Lens, etc.). This process enables users to choose among the variety of graphics types, modify the number aggregations, and highlight specific data segments.
Major features:
- Easy setup procedure
- Data visibility in the log permits finding solutions to potential occurring issues in the production.
- Auto-highlighting feature for the search fields for the quick issues identification in the log files
- Log files visualization, all the essential data display, and real-time stats in graphics.
7. Dynatrace
Dynatrace is presented as a Software intelligence that is meant to simplify cloud complexity by the means of observability, automation, AI, and cloud-native app security in one platform. It is also known as the most compact library that runs in the background of an app occupying less than 10 MB of RAM server. Given that, it results in observing application records without causing server conflicts, yet decreasing server extra resource expenses.
Dynatrace enables software to work virtually seamlessly. Combining deep and broad observability and continuous runtime app security with progressive AIOps to assure responses and intelligent automation from data achieved. Dynatrace makes it possible to maximize cloud automation, and faster and more secure software delivery while ensuring a smooth digital experience.
Being a full-stack toolkit based on one platform it offers automation for dynamic multi-cloud and maintains alignment of numerous teams. Dynatrace ignites harmonious collaboration among business, development, security, and operations with the set of built-in use cases, concentrated in one environment.
Major features:
- Provides with an option to trace time frames for each app stage and transaction flow
- Clear issue identification
- Deviations indications after metrics being benchmarked
- Abnormal activity detection
- User-friendly to non-tech users (a clear picture of the app’s performance)
- Broad multi-cloud and technology support
8. Sensu
Sensu, according to the official source, is perceived as an end-to-end observability pipeline that consolidates monitoring tools and automates analysis, diagnosis, and ways to fix errors.
It is an open-source monitoring solution developed to keep a sharp watch on the servers, services, and apps’ proper performance. Detecting incidental situations, Sensu informs a third-party integration.
Written in Ruby, it easily operates RabbitMQ or Redis for messaging. Redis is mostly used for data storage.
Sensu integrates with other DevOps Stacks ( Slack, HipChat, IRC, PagerDuty).
Sensu modular architecture permits the installation of every component on the same server or totally separate devices. It trades static for dynamic infrastructure while approaching functional role-based monitoring. That results in moving from polling to publish-subscribing from point-and-click interfaces to infrastructure as code processes alongside self-service developer APIs.
Sensu is easy to deploy, manage, and scale.
Major features:
- Performance metrics
- Compliance management
- Uptime monitoring and reporting
- Scheduling support
- Email monitoring
- Event-based modifications
9. Prometheus
Prometheus is an open-source monitoring DevOps services for hire. It integrates with quite a number of systems through the native code or by the means of plugins. Kubernetes orchestration engine uses it as the default monitoring solution.
Prometheus gathers metrical data about the app and the workflow infrastructure from instrumented jobs straight or by the means of an intermediary gateway. It doesn’t collect huge bits of data. Prometheus approaches small chunks of data in order to have a general idea of what’s going on and the trajectory of its further potential.
Prometheus’ main focus is reliability. It is indispensable in dynamic infrastructures, for example, microservices running in the cloud.
Prometheus prioritizes reliability over the accuracy, therefore environments with a top accuracy demand will not benefit from it. Other than that, it fits right when it comes to quick issue identification and feedback on real-time system performance.
This monitoring tool observes for abnormal traffic that can be detected as an attack, guaranteeing security monitoring which is crucial for data protection.
Major features:
- highly dimensional data implementation
- diversity of graphing modes
- time-series efficient storage
- easy to use
- real-time alert notification
- huge collection of client libraries
- excellent third-party integration
Monitoring tools in DevOps culture are supposed to yield peak availability by minimizing the number of critical time-based measurements. Refining the clarity of the performance goals, the DevOps toolset infrastructure proves itself to be essential for predicting the behavior of deployed products in the real-time environments.
Where to Hire DevOps Developer to Improve the Workflow
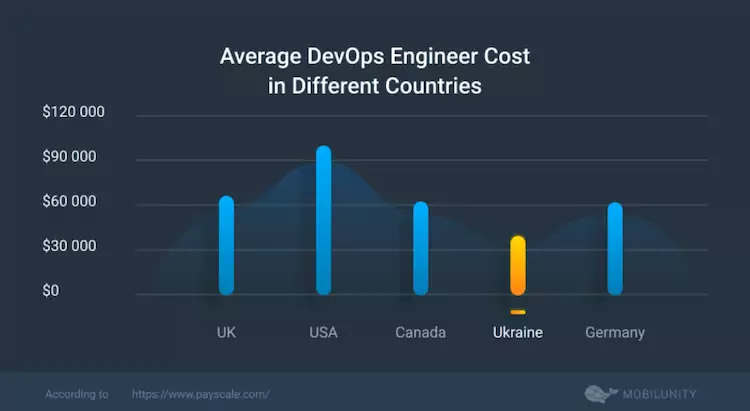
It is already clear why we need DevOps specialists on board. Now it’s also essential to understand where to hire devops developer that will fit the project perfectly. It’s not a discovery that such specialists could be found everywhere, yet, the choice is about the highest quality and the most comfortable price.
Let’s look at the following numbers:
- The USA – $126,301
- Canada – $116,000
- Great Britain – $74 129
- Netherlands – $71 350
- Australia – $132,971
- Japan – $ 99 369
- Ukraine – $19 257
- Poland – $ 33 975
These are DevOps salaries per year in different countries. Eastern Europe has proven itself to be offering high expertise tech talents, owning an extended tech pool. IT specialists offer deep knowledge and high-class experience that comes with smaller money paid. To consider this area for hiring the DevOps engineers looks like quite a winning situation for the business to get maximized and profit-delivering.
DevOps Trends in 2022
DevOps environment is never stable in terms of adopting new tendencies. Seeking to improve and discover even more optimized ways to decrease the amount of manual, and monotonous work, DevOps achieving positive outcomes in services refinement and appropriate delivery.
Here are some 2022 trends that are running for DevOps work optimization with the right tools chosen.
Keeping on with maximizing the automation of a workflow – as it’s been mentioned before – less repetitive tasks, more focus on the most important.
- Adopting Kubernetes towards development – Standardized infrastructure for proactive development.
- No server computing – Fewer issues on the servers, more efficiency and reliability, attention to prioritized tasks.
- Adoption of low code – Reduced coding for building and deploying apps.
- Shifting from DevOps to DevOpsSec – Security enhanced.
- Microservices – Breaking down apps into smaller units to reduce errors.
- Artificial Intelligence – Also refers to bringing more automation into the processes, for example in the image annotation services.
- Hybrid Deployment – Ensures perfect collaboration of local and virtual networking.
Pursuing a competitive future in the IT business those who run it must understand that keeping up with the trends in the field of DevOps engineering is the direct way to achieve the goal.
Conclusion
DevOps engineers are vital for smooth IT business processes, making sure that from an idea being born to its being “packed and delivered ” there occur as few misunderstandings and delays as possible. Via using the trendiest tools and following the latest tendencies DevOps provide a whole new approach to accelerating the product delivery.