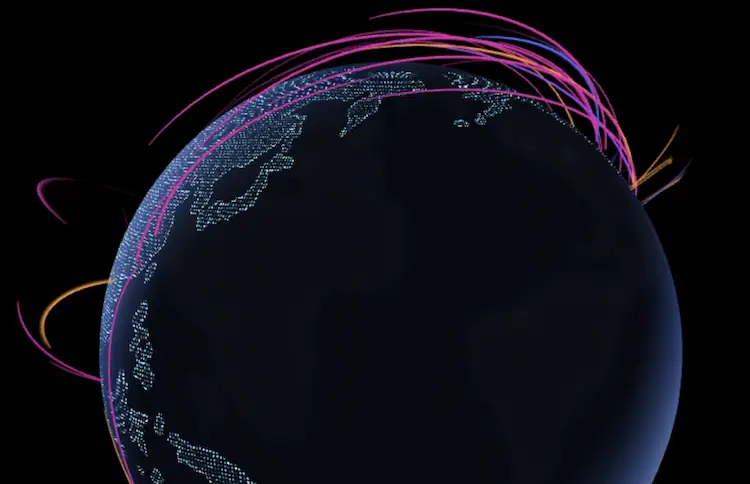


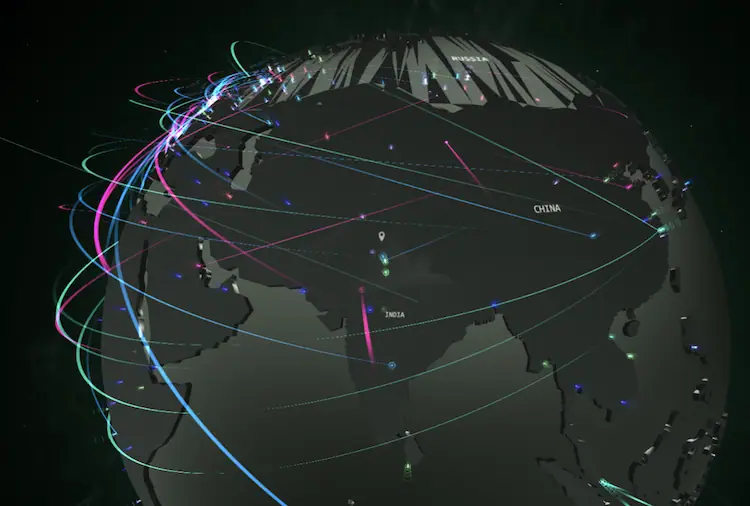
If you’ve ever watched glowing lines crisscross a globe—red pulses from Russia to the U.S., green flares from China to Germany—you’ve seen a live cyber attack map. These dramatic visualizations are everywhere: news broadcasts, cybersecurity vendor websites, even corporate lobbies.
But as a practitioner with 12 years in global threat intelligence and incident response, I need to be clear: these maps are theater, not truth.
They’re not fake—but they’re dangerously incomplete. Let’s dissect what they really show, why they exist, and how professionals use them responsibly.
How Live Attack Maps Actually Work
Most public cyber attack maps rely on one or more of these data sources:
- Honeypots: Decoy systems designed to attract attackers. When scanned or exploited, the event is logged and mapped.
- Partner feeds: Aggregated logs from security vendors, ISPs, or research projects (e.g., Norse, now defunct; or Shadowserver Foundation).
- Telemetry from security products: Some vendors (like Kaspersky or Fortinet) publish anonymized attack data from their global customer base.
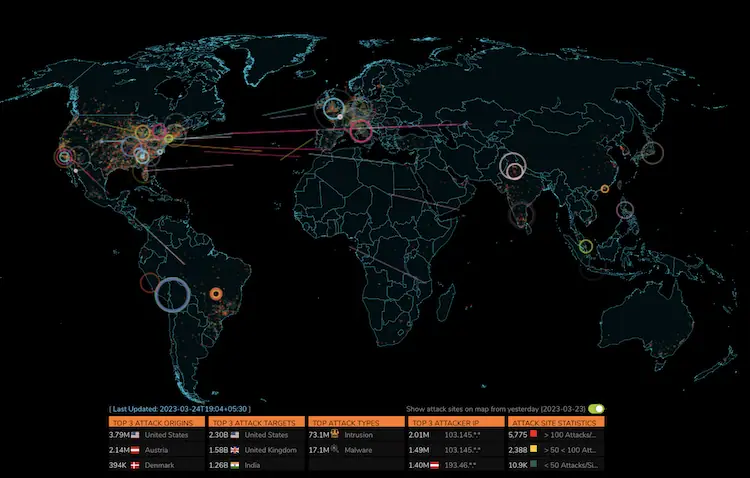
Each event—say, an SSH brute-force attempt from IP 45.123.89.10 to a honeypot in Amsterdam—triggers a line on the map: origin country → target country.
Technically, it’s real. But context is everything.
The 4 Critical Limitations (That Vendors Won’t Tell You)
1. They Show Only What’s Visible—and Most Attacks Aren’t
Encrypted traffic (TLS 1.3), zero-day exploits, spear-phishing, and supply chain attacks leave no trace on these maps. They capture noisy, opportunistic scanning—not sophisticated intrusions.
2. Attribution Is Guesswork
That “attack from North Korea”? More likely a compromised webcam in Brazil routing through a proxy in Seoul. IP geolocation is notoriously inaccurate—especially for cloud and mobile IPs.
3. Volume ≠ Danger
A million port scans from a botnet are less concerning than one stealthy C2 connection from a targeted APT. Yet maps prioritize visual drama over threat severity.
4. They Ignore Defensive Success
When your firewall blocks an attack, it might appear on a map. But when your EDR stops ransomware mid-execution? Silent. Invisible. Unmapped.
Professional Insight: In my SOC, we never use public attack maps for detection or response. We use them for one purpose: illustrating threat landscape trends to executives and board members. They’re storytelling tools—not sensors.
When Are They Actually Useful?
Despite limitations, these maps have legitimate uses:
- Security Awareness Training: Show employees that threats are global and constant.
- Threat Landscape Context: Spot surges in brute-force attacks or worm activity (e.g., during Log4j).
- Research Correlation: Compare with your own logs—if your systems see traffic from the same IPs, investigate.
The Bottom Line for Defenders
Live cyber attack maps are symptom trackers—not diagnostic tools. They show the digital equivalent of coughs and fevers in the global internet body. But they can’t tell you if it’s a cold, flu, or something far worse.
Your real defense comes from:
- Continuous monitoring of your own assets
- Threat intelligence feeds tied to your industry (e.g., FS-ISAC for finance)
- EDR/XDR visibility into endpoints and identities
- Regular red teaming and purple teaming exercises
Use attack maps to stay aware. But never to stay secure.
Frequently Asked Questions
Q: Do these maps show real attacks happening right now?
A: Yes—but only a narrow subset: automated scans, brute-force attempts, and worm propagation. They miss targeted, stealthy, or encrypted attacks.
Q: Why does my country appear as an attack source?
A: Likely due to compromised devices (routers, cameras, servers) within your country being used as bots. It doesn’t imply government involvement.
Q: Can I integrate this data into my SIEM?
A: Some vendors (like Check Point) offer APIs. But raw map data is low-fidelity. Better to subscribe to structured threat intel feeds (STIX/TAXII).
Q: Are these maps used by governments or militaries?
A: Not for operations. National CSIRTs use classified telemetry, network flow data, and malware analysis—not public visualizations.
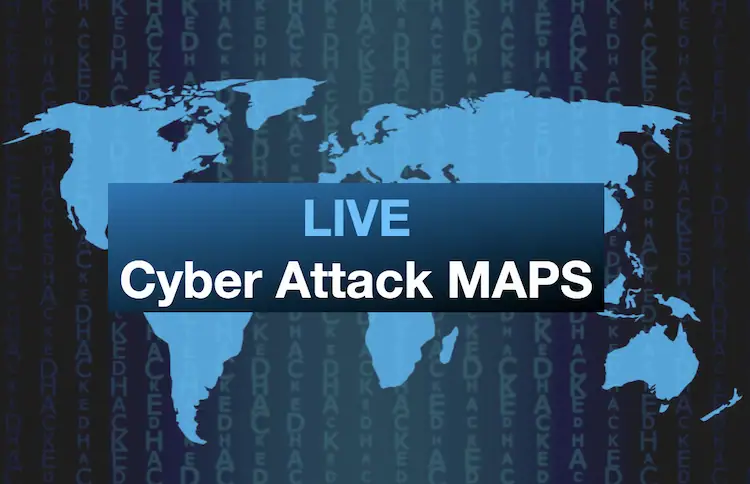
Best real-time cyber attack maps as follow:
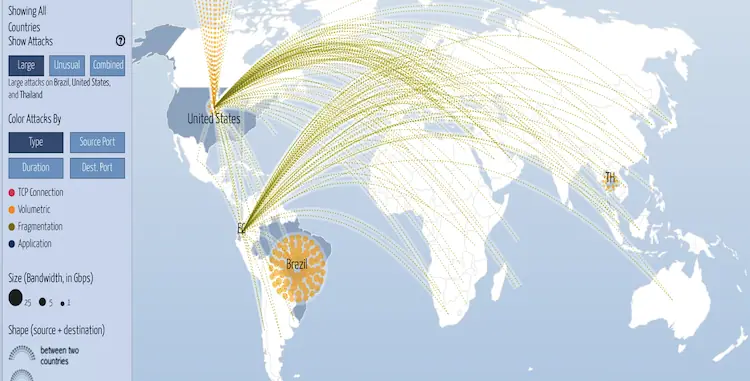
1. DigitalAttack Map
Undoubtedly, the Digital Attack Map is among the most popular and user-friendly cyber attack maps. Cyber attacks are tracked in real-time worldwide, including type, target, and source. Users can also see how past attacks were carried out with the map’s playback feature.
2. Kaspersky’s Cyberthreat Map
With Kaspersky Cyberthreat Real-Time Map, you can see where cyber attacks originate and where they go. The map shows what type of attack, how often it happens, and which sectors are affected. Security professionals can use this info to understand cyber threats better.
3. SonicWall Cyber Attack Maps
Real-time live cyber attack data from SonicWall Security Center.
A next-generation Automated Real-Time Breach Detection and Prevention Platform has been developed by SonicWall to help organizations protect their networks and sensitive data from advanced cyber attacks.
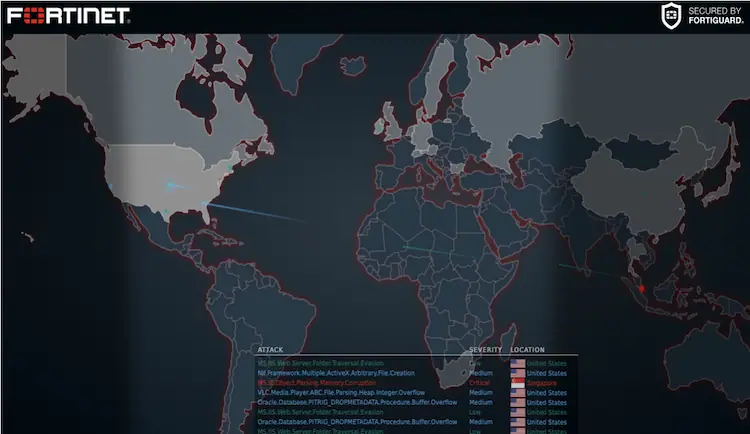
4. Fortinet Threat Map
In the Fortinet Threat Map, you can see where cyber attacks are coming from, who they’re aimed at, and what type of attack they’re doing. Besides malware and botnets, the map also shows other cyber threats.
Staying informed about the latest cyber threats is easy with real-time cyber-attack maps. Security professionals can mitigate the risk of cyber attacks by paying close attention to the data provided by these maps. It’s important to stay one step ahead of cybercriminals and protect your assets, whether you’re a small business owner or an IT security pro.
5.Cisco Talos
Detecting cyber attacks requires a combination of internal and third-party sensors. The knowledge-sharing program also gathers intelligence from our customers.
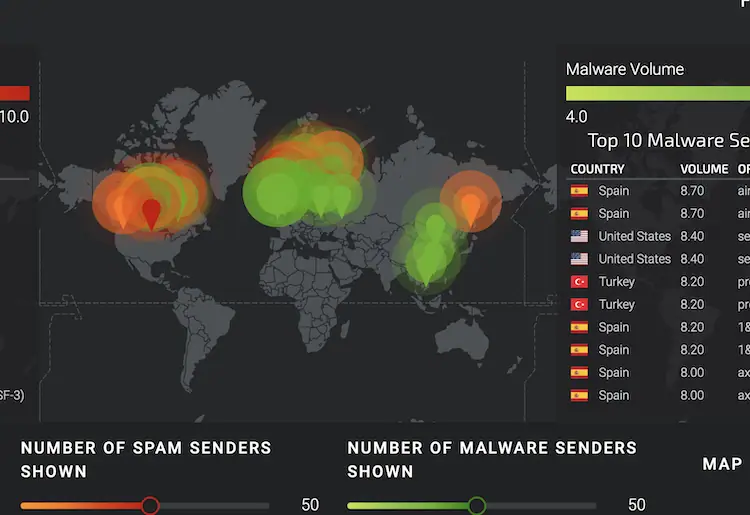
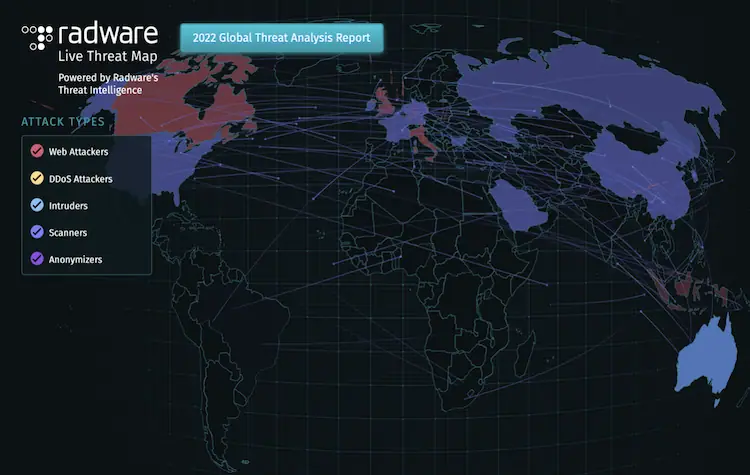
6. Radware
We use our global threat deception network and cloud systems event information to create Radware’s Live Threat Map, which shows cyberattacks as they happen in real time. This map shows network and application attacks that are anonymized and sampled by our Threat Research Center.
7. Checkpoint Threat Map
8.Akamai Internet Station
source for global network traffic and security data from the world’s largest edge platform. Akamai to Learn what factors cause outages and performance issues, and discover traffic trends that predict the future of the internet.