




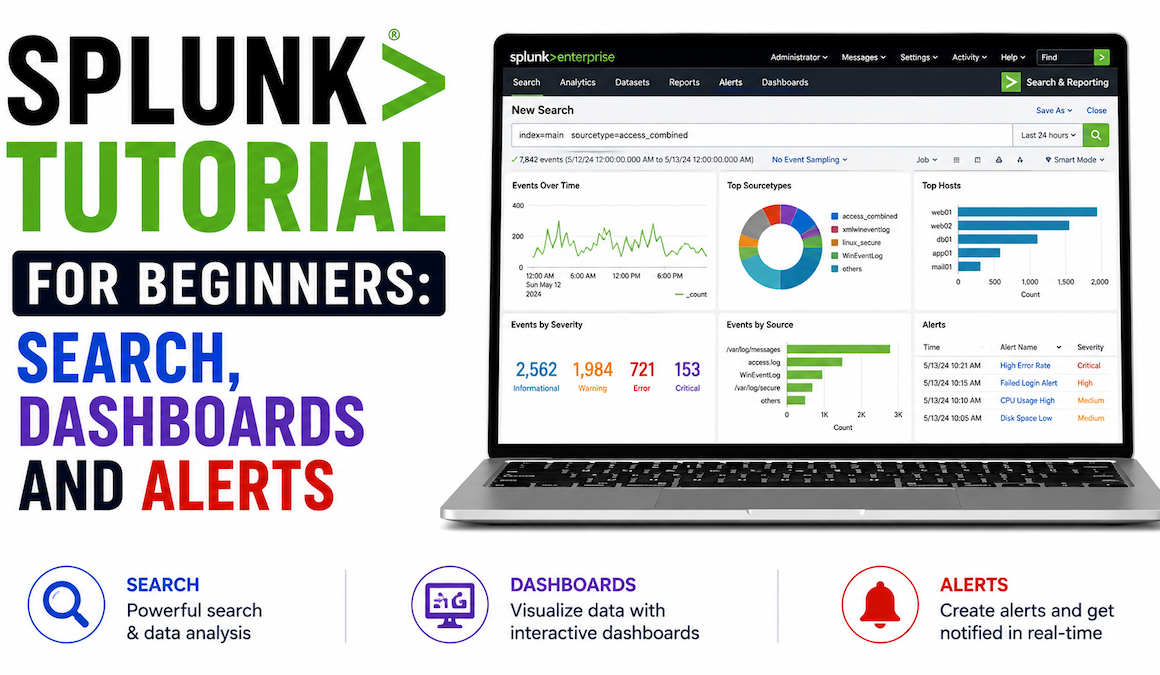
Splunk is the most widely deployed SIEM and log analysis platform in enterprise security. If you work in a SOC, plan to work in one, or are building a security monitoring capability, you will encounter Splunk — and Splunk's Search Processing Language (SPL) will be a daily tool. It appears on SOC analyst job postings more than any other specific tool skill, is tested in four major Splunk certifications, and is the query language used in the most popular threat hunting frameworks including Sigma rule conversions.
This tutorial starts from zero — no prior Splunk experience assumed. You will learn how Splunk ingests and indexes data, how to write SPL searches from simple keyword lookups through to complex statistical analysis, how to build security dashboards that surface the information your SOC needs at a glance, and how to create alerts that fire when your searches detect something worth investigating. Every section includes practical, copy-paste-ready SPL examples oriented toward security use cases.
- What is Splunk? Architecture and core concepts
- Getting started — free trial and installation
- Data ingestion — getting logs into Splunk
- SPL search basics — your first searches
- Essential SPL commands — complete reference
- Statistical analysis with SPL — stats, timechart, and chart
- Security-focused SPL searches — ready to run
- Building security dashboards
- Creating and tuning alerts
- Splunk certifications roadmap
- Frequently asked questions
Splunk is a data platform that collects, indexes, and makes searchable any type of machine-generated data — log files, metrics, network traffic, API outputs, and more. In security contexts it functions as a SIEM: collecting security event logs from across the environment, correlating them to detect threats, generating alerts when suspicious patterns are found, and providing a search interface for investigators and threat hunters.
A lightweight agent installed on systems you want to monitor. The Universal Forwarder collects log data from the local system (Windows Event Logs, application logs, file-based logs) and forwards it to the Splunk Indexer. It uses minimal CPU and memory — designed to run on every managed system without performance impact. The Heavy Forwarder is a full Splunk instance used for parsing and routing data before it reaches the indexer.
Receives data from forwarders, parses it (extracts timestamps, host, source, sourcetype), breaks it into events, and writes it to the index (the on-disk data store). The indexer is where data lives. Searches run against the indexer. In production, multiple indexers run in a cluster for redundancy and search performance.
The component you interact with — the web UI where you write SPL searches, build dashboards, configure alerts, and view results. The Search Head sends search queries to indexers, aggregates the results, and presents them to you. In enterprise deployments, multiple Search Heads form a cluster for high availability.
The data repository — where indexed events are stored on disk, organised by time. Each Splunk deployment has multiple indexes: the default index (confusingly named main), and separate indexes for different data types (a wineventlog index for Windows events, a sysmon index for Sysmon events, a network index for firewall and flow data). Searching a specific index rather than all data dramatically improves search performance.
The query language you use to search and analyse data in Splunk. SPL is a pipeline language — you start with a search that retrieves events, then pipe (|) the results through commands that transform, filter, and aggregate them. Every search and dashboard panel in Splunk is a SPL query. Learning SPL is the core skill of Splunk proficiency.
Splunk Enterprise offers a 60-day free trial at splunk.com/download with a 5GB per day indexing limit. This is enough for a home lab with a few systems. After the trial, Splunk Free is available at 500MB/day with no expiry — sufficient for learning and small environments.
Splunk Cloud is the SaaS version — Splunk manages the infrastructure. A free 15-day trial is available at splunk.com/cloud-trial. No installation required — access immediately via browser. This is the version most enterprise organisations use in production. The search interface and SPL are identical to the on-premises version.
TryHackMe has several free Splunk rooms (search "Splunk" on TryHackMe) that provide a pre-configured Splunk instance with sample data in the browser — no installation needed. This is the fastest way to start practising SPL searches without any setup. Excellent for skill development before setting up your own instance.
Splunk can ingest data from virtually any source. Understanding the key fields Splunk assigns to every event is essential before searching — these are the fields you will filter on constantly.
| Field | What it contains | Example value | How you use it |
|---|---|---|---|
| _time | Event timestamp (Unix epoch) | 1735689600 | Time-based filtering; displayed as human-readable in UI |
| index | Which Splunk index the event lives in | wineventlog, sysmon, main | Always specify index at the start of every search for performance |
| host | Hostname of the system that generated the event | WORKSTATION01, WEBSERVER02 | Filter by specific machines |
| source | Specific file or input the event came from | /var/log/auth.log, WinEventLog:Security | Distinguish between log files on the same host |
| sourcetype | The type of data format — controls how Splunk parses the event | WinEventLog:Security, syslog, json | Essential for field extraction — Splunk has built-in parsers for common sourcetypes |
| _raw | The original, unparsed event text | The full log line as received | Searching _raw is a fallback when fields are not extracted |
For quick one-time data ingestion (uploading a log file for investigation or a practice dataset), use Settings → Add Data → Upload. Select the file, choose the sourcetype, and Splunk immediately indexes it and makes it searchable. This is the fastest way to get sample data into Splunk for practice — download a sample Windows event log or auth.log file and upload it.
Every SPL search starts at the Splunk Search Bar (found at Search & Reporting → New Search). The search bar accepts SPL and executes it against your indexed data when you press Enter or click the search button.
SPL is a pipeline language. Every search is a sequence of commands separated by the pipe character (|). The first part retrieves events; subsequent commands transform those events. Read it left to right: "get these events, then do this, then do that."
Every search runs over a time range. Set it using the time picker in the UI (top right of the search bar) or inline in the SPL:
After running a search, Splunk displays a sidebar showing all fields extracted from the results with their top values and a count. Click any field name to see its top values. Click any value to add it to your search as a filter. This is the fastest way to explore a new data source — run a broad search, then use the sidebar to narrow down to interesting values without writing field filters manually.
SPL has over 140 commands. In practice, 15–20 commands cover the vast majority of security use cases. Master these before anything else.
These searches are production-ready. Copy them into your Splunk search bar, adjust the index names to match your environment, and run them. Each one addresses a real security use case.
Dashboards in Splunk are collections of panels, each powered by a SPL search. They update automatically on a schedule and give the SOC team a real-time view of the security state without running searches manually.
Every Splunk Classic Dashboard has an underlying XML definition. Click Edit → Edit Source to see and edit it directly. This is the fastest way to add multiple panels, copy panels between dashboards, or make bulk changes. The XML structure is straightforward:
Splunk alerts run a saved search on a schedule and trigger an action — email, webhook, SOAR integration, or custom script — when the results meet a defined condition. Well-written alerts are specific, high-confidence, and low-noise. Poorly written alerts create alert fatigue that makes the entire security monitoring programme less effective.
Never create an alert from a search you have not run and reviewed manually. Run the search, verify it returns what you expect, check the false positive rate, and only save it as an alert when you are confident it produces actionable results.
After running a search: Save As → Alert. Set the alert title (use the pattern: "[SEVERITY] - [What is happening] - [Where]"), description, and permissions.
What happens when the alert fires:
- Send email: To the SOC team distribution list. Include search results in the email body (configure via "Include search results in email"). Format: "[ALERT] Brute force detected on WORKSTATION01 — 847 failed logins in 5 minutes."
- Webhook: POST alert data to a URL — used for SOAR integration (Splunk SOAR, XSOAR) and chat platforms (Slack, Teams). The webhook receives the alert payload as JSON and triggers a SOAR playbook.
- Add to Triggered Alerts: Log to Splunk's triggered alerts view for analyst review.
- Run a script: Execute a custom Python or shell script with the alert data. Used for custom integrations.
Alert fatigue occurs when too many alerts fire with too low signal-to-noise ratio. Analysts start ignoring alerts — including real incidents. Tuning is an ongoing process:
- Raise thresholds: If an alert fires constantly for benign activity, raise the count threshold. A brute force alert at 10 failures/5 min fires for every password-forgetting user; at 100 failures/5 min it fires only for actual brute force.
- Add exclusions: Add NOT conditions to exclude known-good sources. Vulnerability scanners generate masses of failed login attempts — add them to an exclusion list in a lookup table rather than hardcoding IPs in the search.
- Use lookups for whitelists: Maintain a CSV lookup of known-good IPs, known-good processes, and approved scheduled tasks. Reference the lookup in your alerts to automatically exclude approved activity.
- Measure and review: Track false positive rate per alert monthly. Any alert with above 80% false positive rate needs tuning or retirement.
Splunk offers a structured certification pathway from beginner through architect level. These certifications validate real skills that employers test for in interviews and that are referenced in job postings constantly.
⚡ Getting started with Splunk today
- Start with a TryHackMe Splunk room this week — search "Splunk" on TryHackMe and start with the "Splunk: Basics" room. It is free, requires no installation, and gives you a live Splunk instance with sample security data to practice on immediately. This is the fastest zero-to-first-search path available.
- Download Splunk Free and ingest your own system's logs — install Splunk on your home lab machine, install the Universal Forwarder on a Windows VM, forward the Windows Security event log, and run the security searches from Section 7. Seeing real data from your own environment makes the concepts immediately tangible.
- Take Splunk Fundamentals 1 (free online) — the official Splunk training course at splunk.com/training. Free, self-paced, about 9 hours. Covers everything in this tutorial and more, with hands-on exercises in a guided Splunk environment. Complete this before attempting the certification exam.
- Connect Splunk to your security stack — Splunk is the data layer that powers both SOAR and threat hunting. Understanding how all three work together is the foundation of modern SOC operations. SOAR guide → | Threat hunting guide →
- Build toward the SOC analyst role — Splunk SPL is one of the core skills listed in virtually every SOC analyst job posting. Combine it with understanding of SIEM concepts, incident response, and threat hunting to build a complete skill set. SOC analyst career guide →
In cybersecurity, Splunk is used as a SIEM (Security Information and Event Management) platform — collecting security logs from across an organisation's infrastructure, correlating them to detect threats, and providing search and investigation capabilities for security analysts. Specific use cases include: monitoring for failed login attempts and brute force attacks, detecting malware execution and suspicious process activity, identifying lateral movement and privilege escalation, threat hunting through historical log data, compliance reporting (collecting evidence that security controls are operating), and powering SOAR automation by providing the alert source that triggers automated playbooks. It is the most widely deployed enterprise SIEM platform globally.
SPL stands for Search Processing Language — the query language used to search and analyse data in Splunk. It is a pipeline language: you start with a search that retrieves events, then pipe the results through commands that filter, transform, and aggregate them. For example: index=wineventlog EventCode=4625 | stats count by AccountName | sort -count retrieves failed login events, counts them by account name, and sorts by count. SPL has over 140 commands, but security analysts need to master around 15–20 commands to cover the vast majority of use cases. SPL knowledge is the single most in-demand Splunk skill in SOC analyst job postings.
Splunk offers a free tier (Splunk Free) with 500MB per day of data indexing and no time limit — sufficient for learning, home labs, and small environments. The 60-day trial provides up to 5GB per day. Splunk Enterprise (paid) has no data volume limit and adds clustering, advanced access control, and premium support. Splunk Cloud, the SaaS version, offers a 15-day free trial. For beginners, the free tier is more than sufficient to learn SPL, build dashboards, and practise with security data. TryHackMe also offers free browser-based Splunk instances with sample data for structured learning without any local installation.
Basic SPL search proficiency — enough to write security searches, build simple dashboards, and create alerts — takes 2–4 weeks of focused daily practice for someone with general IT or security background. The free Splunk Fundamentals 1 course (9 hours) covers the foundations. Passing the Core Certified User exam typically requires 4–6 weeks of study and practice. Becoming genuinely proficient at security-focused SPL (able to write complex threat hunting queries and build production dashboards) takes 3–6 months of daily use in a real or lab environment. The fastest path is consistent daily hands-on practice with real data — no amount of reading replaces time in the search bar.
Both are enterprise SIEM platforms — Splunk is the market leader by deployment count, while Microsoft Sentinel is the fastest-growing alternative. Key differences: Splunk uses SPL (Search Processing Language) while Sentinel uses KQL (Kusto Query Language) — both are powerful but have different syntax. Splunk is available as on-premises or cloud; Sentinel is cloud-only (Azure-hosted). Sentinel is included in Microsoft 365 E5 licensing, making it effectively free for many Microsoft-centric organisations. Splunk has a larger community, more pre-built content (Splunkbase), and is historically stronger at large-scale log management. Sentinel has better native integration with Microsoft products (Entra ID, Defender, Intune, Teams). Both certifications are valued — most SOC analysts should develop proficiency in at least one, and many organisations run both.
For most security analysts and aspiring SOC analysts, the recommended first certification is Splunk Core Certified User — it validates fundamental SPL and UI skills, costs around $130 USD, and is a prerequisite for higher certifications. After that, Splunk Core Certified Power User (advanced SPL, lookups, report acceleration) is the most valuable exam for day-to-day SOC analyst work. If your role is specifically focused on Splunk Enterprise Security (the SIEM product), the Splunk Enterprise Security Certified Admin is the highest-value credential — it validates ES-specific knowledge including correlation searches, notable events, and risk-based alerting. Start with the free Splunk Fundamentals 1 course before any exam.