

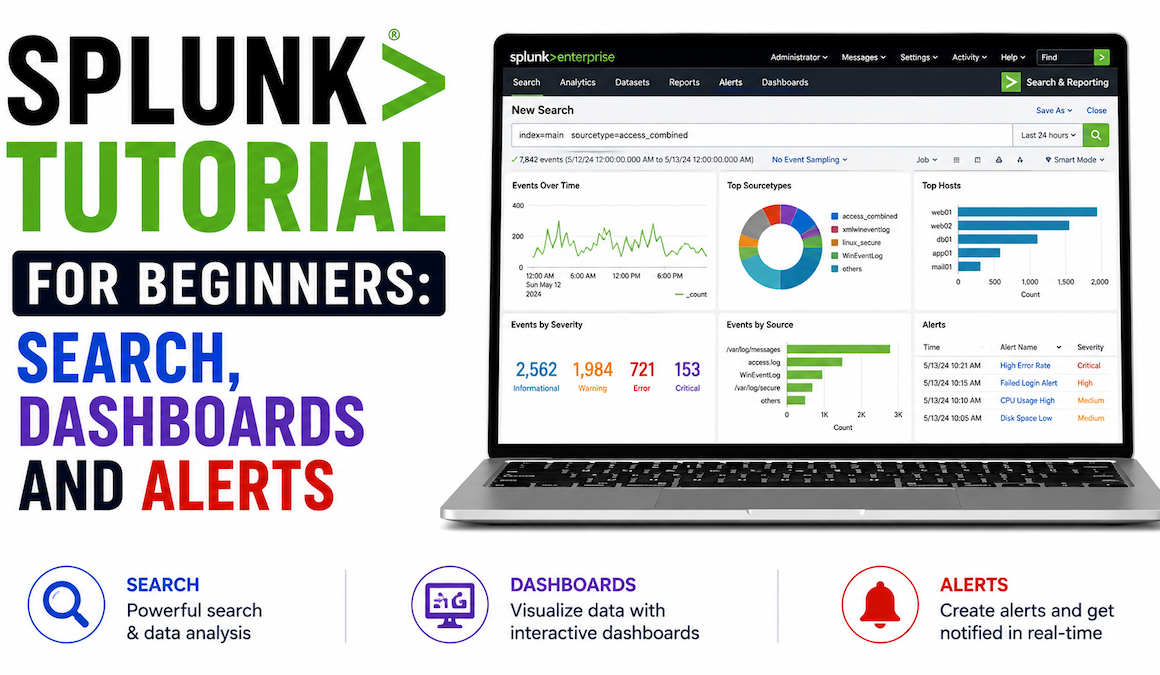
Splunk Tutorial for Beginners: Search, Dashboards and Alerts (2026)

Splunk Tutorial
Splunk Tutorial
By HOC Team  |  Last updated: July 2026  |  Read time: ~25 min

Splunk is the most widely deployed SIEM and log analysis platform in enterprise security. If you work in a SOC, plan to work in one, or are building a security monitoring capability, you will encounter Splunk — and Splunk's Search Processing Language (SPL) will be a daily tool. It appears on SOC analyst job postings more than any other specific tool skill, is tested in four major Splunk certifications, and is the query language used in the most popular threat hunting frameworks including Sigma rule conversions.

This tutorial starts from zero — no prior Splunk experience assumed. You will learn how Splunk ingests and indexes data, how to write SPL searches from simple keyword lookups through to complex statistical analysis, how to build security dashboards that surface the information your SOC needs at a glance, and how to create alerts that fire when your searches detect something worth investigating. Every section includes practical, copy-paste-ready SPL examples oriented toward security use cases.

📊 Splunk in 2026 Used in 92 of the Fortune 100 · 67% of enterprise SOC analyst job postings require Splunk/SPL · Splunk indexes over 1.2 petabytes per day globally · Splunk certifications among the top 10 most valued security certifications · Acquired by Cisco in March 2024 — product roadmap continues under Splunk brand
1. What is Splunk? Architecture and core concepts

Splunk is a data platform that collects, indexes, and makes searchable any type of machine-generated data — log files, metrics, network traffic, API outputs, and more. In security contexts it functions as a SIEM: collecting security event logs from across the environment, correlating them to detect threats, generating alerts when suspicious patterns are found, and providing a search interface for investigators and threat hunters.

🏗
Splunk core components — the five pieces you need to know
Forwarder

A lightweight agent installed on systems you want to monitor. The Universal Forwarder collects log data from the local system (Windows Event Logs, application logs, file-based logs) and forwards it to the Splunk Indexer. It uses minimal CPU and memory — designed to run on every managed system without performance impact. The Heavy Forwarder is a full Splunk instance used for parsing and routing data before it reaches the indexer.

Indexer

Receives data from forwarders, parses it (extracts timestamps, host, source, sourcetype), breaks it into events, and writes it to the index (the on-disk data store). The indexer is where data lives. Searches run against the indexer. In production, multiple indexers run in a cluster for redundancy and search performance.

Search Head

The component you interact with — the web UI where you write SPL searches, build dashboards, configure alerts, and view results. The Search Head sends search queries to indexers, aggregates the results, and presents them to you. In enterprise deployments, multiple Search Heads form a cluster for high availability.

Index

The data repository — where indexed events are stored on disk, organised by time. Each Splunk deployment has multiple indexes: the default index (confusingly named main), and separate indexes for different data types (a wineventlog index for Windows events, a sysmon index for Sysmon events, a network index for firewall and flow data). Searching a specific index rather than all data dramatically improves search performance.

SPL — Search Processing Language

The query language you use to search and analyse data in Splunk. SPL is a pipeline language — you start with a search that retrieves events, then pipe (|) the results through commands that transform, filter, and aggregate them. Every search and dashboard panel in Splunk is a SPL query. Learning SPL is the core skill of Splunk proficiency.

Splunk architecture — data flow from source systems through forwarders, indexers, to the search head
Splunk Architecture — Data Flow DATA SOURCES 🖥 Windows Servers 🐧 Linux / macOS 🔥 Firewall / Network ☁ Cloud / APIs 💻 Endpoints / EDR Universal Forwarder Collects + ships data (TLS) Encrypted stream INDEXER CLUSTER Indexer 1 Parse · Timestamp · Index Indexer 2 Data store + replication Indexes: main · sysmon wineventlog · network Search results SEARCH HEAD Web UI (port 8000) 🔍 SPL Search Bar 📊 Dashboards 🔔 Alerts
2. Getting started — free trial and installation
🚀
Three ways to start with Splunk
Free options available
Option 1 — Splunk Free Trial (recommended for beginners)

Splunk Enterprise offers a 60-day free trial at splunk.com/download with a 5GB per day indexing limit. This is enough for a home lab with a few systems. After the trial, Splunk Free is available at 500MB/day with no expiry — sufficient for learning and small environments.

# Install Splunk Enterprise on Linux (Ubuntu/Debian) # Download from splunk.com/download — replace with current version URL wget -O splunk.deb 'https://download.splunk.com/products/splunk/releases/9.x.x/linux/splunk-9.x.x-linux-amd64.deb' sudo dpkg -i splunk.deb sudo /opt/splunk/bin/splunk start --accept-license # Set admin password when prompted, then access at: # http://localhost:8000 (or your server IP:8000) # Install Splunk on Windows: # Run the downloaded .msi installer as Administrator # Splunk starts as a Windows service — access at http://localhost:8000
Option 2 — Splunk Cloud (fully managed, no installation)

Splunk Cloud is the SaaS version — Splunk manages the infrastructure. A free 15-day trial is available at splunk.com/cloud-trial. No installation required — access immediately via browser. This is the version most enterprise organisations use in production. The search interface and SPL are identical to the on-premises version.

Option 3 — TryHackMe / Hack The Box Splunk labs

TryHackMe has several free Splunk rooms (search "Splunk" on TryHackMe) that provide a pre-configured Splunk instance with sample data in the browser — no installation needed. This is the fastest way to start practising SPL searches without any setup. Excellent for skill development before setting up your own instance.

Installing the Universal Forwarder on client systems
# Universal Forwarder — install on systems you want to monitor # Download from splunk.com/universal-forwarder # Linux install and configure wget -O splunkuf.deb 'https://download.splunk.com/products/universalforwarder/...' sudo dpkg -i splunkuf.deb sudo /opt/splunkforwarder/bin/splunk start --accept-license sudo /opt/splunkforwarder/bin/splunk add forward-server 192.168.1.100:9997 # Replace 192.168.1.100 with your Splunk indexer IP # Add a log input — monitor a specific file sudo /opt/splunkforwarder/bin/splunk add monitor /var/log/syslog -index main -sourcetype syslog # Windows — collect Windows Event Logs via inputs.conf # Create: C:\Program Files\SplunkUniversalForwarder\etc\system\local\inputs.conf [WinEventLog://Security] disabled = 0 index = wineventlog renderXml = true [WinEventLog://System] disabled = 0 index = wineventlog [WinEventLog://Application] disabled = 0 index = wineventlog
3. Data ingestion — getting logs into Splunk

Splunk can ingest data from virtually any source. Understanding the key fields Splunk assigns to every event is essential before searching — these are the fields you will filter on constantly.

📊
Default Splunk fields — every event has these
Know these before writing your first search
FieldWhat it containsExample valueHow you use it
_timeEvent timestamp (Unix epoch)1735689600Time-based filtering; displayed as human-readable in UI
indexWhich Splunk index the event lives inwineventlog, sysmon, mainAlways specify index at the start of every search for performance
hostHostname of the system that generated the eventWORKSTATION01, WEBSERVER02Filter by specific machines
sourceSpecific file or input the event came from/var/log/auth.log, WinEventLog:SecurityDistinguish between log files on the same host
sourcetypeThe type of data format — controls how Splunk parses the eventWinEventLog:Security, syslog, jsonEssential for field extraction — Splunk has built-in parsers for common sourcetypes
_rawThe original, unparsed event textThe full log line as receivedSearching _raw is a fallback when fields are not extracted
Critical security data sources and their sourcetypes
# Most important data sources for security monitoring # Specify these in your searches to limit scope and improve performance sourcetype=WinEventLog:Security # Windows Security events (4624, 4625, 4688...) sourcetype=XmlWinEventLog:Sysmon # Sysmon events (1=process, 3=network, 10=access) sourcetype=WinEventLog:System # Windows System events (service installs, etc.) sourcetype=linux_secure # Linux /var/log/secure (auth events) sourcetype=syslog # Generic syslog (firewalls, network devices) sourcetype=pan_traffic # Palo Alto firewall traffic logs sourcetype=cisco:asa # Cisco ASA firewall logs sourcetype=stream:dns # DNS logs (via Splunk Stream) sourcetype=aws:cloudtrail # AWS CloudTrail API logs sourcetype=o365:management:activity # Microsoft 365 audit logs
Using Add Data in the Splunk UI

For quick one-time data ingestion (uploading a log file for investigation or a practice dataset), use Settings → Add Data → Upload. Select the file, choose the sourcetype, and Splunk immediately indexes it and makes it searchable. This is the fastest way to get sample data into Splunk for practice — download a sample Windows event log or auth.log file and upload it.

Install the Splunk Add-on for Microsoft Sysmon (SA-Sysmon) from Splunkbase. Sysmon generates rich endpoint telemetry (process creation with full command lines, network connections, file operations, registry changes) and is one of the most valuable data sources for security monitoring. The SA-Sysmon add-on automatically extracts all Sysmon fields and maps them to the Splunk Common Information Model (CIM). This is the single most impactful add-on for a security-focused Splunk deployment.
4. SPL search basics — your first searches

Every SPL search starts at the Splunk Search Bar (found at Search & Reporting → New Search). The search bar accepts SPL and executes it against your indexed data when you press Enter or click the search button.

🔍
SPL fundamentals — how searches work
Start here before anything else
The pipeline structure

SPL is a pipeline language. Every search is a sequence of commands separated by the pipe character (|). The first part retrieves events; subsequent commands transform those events. Read it left to right: "get these events, then do this, then do that."

# Basic pipeline structure index=wineventlog EventCode=4625 ← Search: get failed login events | stats count by AccountName ← Transform: count by username | sort -count ← Sort: highest count first | head 10 ← Limit: top 10 only # Always specify: index, time range, and key filters at the start # This is the most important performance habit in SPL
Time range selection

Every search runs over a time range. Set it using the time picker in the UI (top right of the search bar) or inline in the SPL:

# Inline time specification using earliest= and latest= index=wineventlog earliest=-24h latest=now # Last 24 hours index=wineventlog earliest=-7d@d latest=@d # Last 7 complete days index=wineventlog earliest=-1h@h latest=@h # Last complete hour index=wineventlog earliest=01/01/2026:00:00:00 latest=01/02/2026:00:00:00 # Snap-to notation (@ rounds to the nearest unit boundary) # @d = start of today | @h = start of current hour | @w = start of week
Searching — keywords, fields, and wildcards
# Keyword search — finds events containing this string anywhere in _raw index=wineventlog "failed password" # Field=value search — searches a specific extracted field index=wineventlog EventCode=4625 index=wineventlog AccountName="jsmith" index=sysmon Image="C:\\Windows\\System32\\powershell.exe" # Wildcards — * matches any characters index=wineventlog AccountName="admin*" # Accounts starting with "admin" index=sysmon CommandLine="*-EncodedCommand*" # Boolean operators — AND, OR, NOT (caps matter) index=wineventlog EventCode=4625 AND AccountName="administrator" index=wineventlog (EventCode=4624 OR EventCode=4625) index=wineventlog EventCode=4624 NOT AccountName="SYSTEM" # Multiple values for same field — IN operator index=wineventlog EventCode IN (4624, 4625, 4634, 4647, 4648) # NOT — exclude specific values index=sysmon EventCode=1 | where NOT (Image="C:\\Windows\\System32\\svchost.exe" OR Image="C:\\Windows\\explorer.exe")
Using the field sidebar

After running a search, Splunk displays a sidebar showing all fields extracted from the results with their top values and a count. Click any field name to see its top values. Click any value to add it to your search as a filter. This is the fastest way to explore a new data source — run a broad search, then use the sidebar to narrow down to interesting values without writing field filters manually.

Always specify the index first. The most common beginner mistake is writing searches without specifying an index: EventCode=4625. This searches across ALL indexes — every byte of data in your Splunk deployment — which is extremely slow and resource-intensive. Always start with: index=wineventlog EventCode=4625. Your index specification is the most important performance optimisation in SPL.
5. Essential SPL commands — complete reference

SPL has over 140 commands. In practice, 15–20 commands cover the vast majority of security use cases. Master these before anything else.

search
Filtering
Filter events matching a keyword or field condition anywhere in the pipeline. Used within a pipeline to further filter events after an initial search.
| search AccountName="admin*"
where
Filtering
Filter events using evaluated expressions. More powerful than search — supports functions, comparisons, and complex conditions. Works on computed fields.
| where count > 100 AND len(AccountName) > 15
stats
Aggregation
Calculate aggregate statistics. Most important SPL command. Functions: count, sum, avg, max, min, dc (distinct count), values, list, earliest, latest.
| stats count by AccountName, ComputerName
timechart
Aggregation
Like stats but groups by time intervals. Creates time-series data for charts. Essential for trending and over-time visualisations.
| timechart span=1h count by EventCode
chart
Aggregation
Like stats but formats output for chart visualisation. Creates two-dimensional tabular data — X axis and split-by field.
| chart count over host by EventCode
sort
Transformation
Sort results by one or more fields. Prefix with minus for descending order. Default is ascending.
| sort -count | sort +AccountName
head / tail
Transformation
Return only the first N (head) or last N (tail) results. Use after sort to get top/bottom N values.
| head 20 | tail 5
table
Transformation
Select which fields to display and in what order. Reduces clutter in search results — show only the columns you need. Also renames fields (via rename before table).
| table _time, host, AccountName, EventCode
rename
Transformation
Rename fields for cleaner output. Useful for making results more readable in dashboards and reports.
| rename AccountName AS "Username"
eval
Computed fields
Create or modify fields using expressions. Supports math, string functions, conditionals (if), and time functions. One of the most powerful SPL commands.
| eval risk_score = if(count>100, "HIGH", "LOW")
rex
Computed fields
Extract fields using regular expressions. Essential for parsing fields from raw log text that Splunk did not automatically extract.
| rex field=_raw "src_ip=(?P<src_ip>\d+\.\d+\.\d+\.\d+)"
dedup
Computed fields
Remove duplicate events based on field values. Useful when you want unique values rather than all occurrences.
| dedup AccountName, ComputerName
join
Correlation
Join results from two searches on a common field. Like SQL JOIN. Used to correlate events from different data sources (e.g. join login events with firewall logs on source IP).
| join AccountName [search index=hr_data]
lookup
Correlation
Enrich events with data from an external lookup table (CSV file or KV store). Essential for adding context: asset ownership, known-bad IP lists, user-to-department mapping.
| lookup asset_list ip OUTPUT owner, criticality
inputlookup
Correlation
Search a lookup table as a data source. Useful for tracking persistent state — e.g. a running blocklist maintained in a KV store lookup.
| inputlookup threat_iocs.csv WHERE type="ip"
transaction
Session analysis
Group related events into transactions based on field values and time constraints. Useful for session analysis — group all events from the same user session or from the same attacker IP.
| transaction AccountName maxspan=5m
iplocation
Enrichment
Automatically look up geographic information for IP addresses — country, city, latitude, longitude. Uses built-in MaxMind database. Essential for geo-based threat hunting.
| iplocation src_ip
eventstats
Statistical
Like stats but adds the result as new fields to each original event rather than collapsing events into summary rows. Used for anomaly detection — compute a baseline and compare each event against it.
| eventstats avg(count) AS avg_count by host
6. Statistical analysis with SPL — stats, timechart, and chart
📈
stats, timechart, and chart — the aggregation trio
These three commands power 90% of security dashboards
stats — aggregate and group
# stats count — simple event counts index=wineventlog EventCode=4625 | stats count by AccountName | sort -count Result: AccountName | count administrator | 847 jsmith | 23 # stats with multiple functions index=wineventlog EventCode=4624 | stats count AS total_logins, dc(ComputerName) AS unique_hosts, earliest(_time) AS first_seen, latest(_time) AS last_seen, values(src_ip) AS source_ips by AccountName | eval first_seen = strftime(first_seen, "%Y-%m-%d %H:%M") | eval last_seen = strftime(last_seen, "%Y-%m-%d %H:%M") | sort -total_logins # dc() = distinct count — unique values (not total occurrences) # values() = collect all unique values into a multi-value field # earliest/latest = first/last occurrence timestamp
timechart — event volume over time
# timechart — group by time interval, perfect for trend lines index=wineventlog earliest=-7d | timechart span=1h count by EventCode Result: time | 4624 | 4625 | 4688 ... (Each row = one hour. Each column = count of that event code. This becomes a stacked line chart in the dashboard.) # Limit to top N series with limit= (prevents chart clutter) index=wineventlog EventCode=4625 earliest=-24h | timechart span=15m count by AccountName limit=5 # Shows top 5 accounts with most failed logins, grouped into 15-min buckets
Statistical anomaly detection — z-score method
# Find statistical outliers — hosts generating 2.5+ standard deviations # more failed logins than average. This is the core of behavioural detection. index=wineventlog EventCode=4625 earliest=-7d | stats count by host | eventstats avg(count) AS mean_count, stdev(count) AS stdev_count | eval z_score = (count - mean_count) / (stdev_count + 0.001) | where z_score >= 2.5 | table host, count, mean_count, z_score | sort -z_score # Results: hosts whose failed login count is 2.5+ standard deviations above average
Rare events — stack counting for anomaly detection
# Rarity analysis — find parent-child process pairs that appear very rarely # Rare pairs are often indicators of malicious activity # (Most malware runs on very few machines; legitimate software runs on many) index=sysmon EventCode=1 earliest=-30d | stats dc(host) AS host_count, values(CommandLine) AS cmdlines by ParentImage, Image | where host_count <= 2 | where NOT (Image="C:\\Windows\\System32\\svchost.exe" OR Image="C:\\Windows\\explorer.exe" OR match(Image, "\\\\Program Files\\\\")) | sort host_count
7. Security-focused SPL searches — ready to run

These searches are production-ready. Copy them into your Splunk search bar, adjust the index names to match your environment, and run them. Each one addresses a real security use case.

🛡
Security search library — 12 essential searches
Adjust index names for your environment
1. Brute force detection — accounts with many failed logins
index=wineventlog EventCode=4625 earliest=-1h | stats count AS failures, dc(WorkstationName) AS source_hosts, values(WorkstationName) AS source_list by AccountName | where failures >= 20 | sort -failures | table AccountName, failures, source_hosts, source_list
2. Successful login after multiple failures — brute force success
# Accounts with many failures followed by a success in the same window index=wineventlog (EventCode=4624 OR EventCode=4625) earliest=-1h | stats count(eval(EventCode=4625)) AS failures, count(eval(EventCode=4624)) AS successes by AccountName | where failures >= 10 AND successes >= 1 | sort -failures
3. Office applications spawning shells — phishing detection
index=sysmon EventCode=1 | where (match(ParentImage, "(?i)(winword|excel|outlook|powerpnt)\.exe")) AND (match(Image, "(?i)(powershell|cmd|wscript|cscript|mshta|rundll32)\.exe")) | table _time, host, User, ParentImage, Image, CommandLine | sort -_time
4. PowerShell with encoded commands
index=sysmon EventCode=1 | where match(Image, "(?i)powershell\.exe") AND match(CommandLine, "(?i)(-enc|-encodedcommand|-ec)\s+[A-Za-z0-9+/=]{20,}") | table _time, host, User, CommandLine, ParentImage | sort -_time
5. New local administrator accounts created
# EventCode 4720 = account created | 4732 = added to security-enabled local group index=wineventlog (EventCode=4720 OR EventCode=4732) earliest=-24h | where EventCode=4732 AND TargetUserName="Administrators" | table _time, host, SubjectUserName, MemberName, TargetUserName | sort -_time
6. Lateral movement — same account logging into many hosts
index=wineventlog EventCode=4624 LogonType=3 earliest=-1h | stats dc(ComputerName) AS unique_hosts, values(ComputerName) AS host_list by AccountName, IpAddress | where unique_hosts >= 5 | sort -unique_hosts | table AccountName, IpAddress, unique_hosts, host_list
7. New services installed (persistence / lateral movement)
# EventCode 7045 = new service installed on Windows # Attackers use services for persistence and to move laterally via PsExec index=wineventlog EventCode=7045 earliest=-24h | where NOT (match(ServiceFileName, "(?i)(\\\\Windows\\\\|\\\\Program Files\\\\)")) | table _time, host, AccountName, ServiceName, ServiceFileName, ServiceType | sort -_time
8. Outbound connections to rare destinations (C2 hunting)
# Find hosts making outbound connections to external IPs not seen historically index=network direction=outbound earliest=-24h | stats dc(dest_ip) AS unique_dests, sum(bytes) AS total_bytes by src_ip | eventstats avg(total_bytes) AS avg_bytes, stdev(total_bytes) AS stdev_bytes | eval z_score = (total_bytes - avg_bytes) / (stdev_bytes + 1) | where z_score > 3 | sort -z_score | table src_ip, unique_dests, total_bytes, z_score
9. Security log cleared — attacker covering tracks
# EventCode 1102 = Security audit log cleared # This should almost never happen — any result is high priority index=wineventlog EventCode=1102 | table _time, host, SubjectUserName, SubjectDomainName | sort -_time
10. Login from unusual countries — impossible travel indicator
index=wineventlog EventCode=4624 earliest=-24h | where LogonType=3 OR LogonType=10 | iplocation IpAddress | stats dc(Country) AS country_count, values(Country) AS countries, values(IpAddress) AS ip_list by AccountName | where country_count >= 2 | sort -country_count | table AccountName, country_count, countries, ip_list
11. Suspicious scheduled task creation
# EventCode 4698 = scheduled task created # 4702 = scheduled task updated index=wineventlog (EventCode=4698 OR EventCode=4702) earliest=-24h | where NOT (match(SubjectUserName, "(?i)(system|local service|network service)")) | rex field=TaskContent "<Command>(?P<task_command>[^<]+)<\/Command>" | table _time, host, SubjectUserName, TaskName, task_command | sort -_time
12. High-volume DNS queries from single host (DNS tunnelling)
index=dns earliest=-1h | stats count AS query_count, dc(query) AS unique_queries by src_ip | where query_count > 1000 OR unique_queries > 500 | sort -query_count | table src_ip, query_count, unique_queries
8. Building security dashboards

Dashboards in Splunk are collections of panels, each powered by a SPL search. They update automatically on a schedule and give the SOC team a real-time view of the security state without running searches manually.

📊
Building your first security overview dashboard
Step-by-step guide
1
Create a new dashboard
Search & Reporting → Dashboards → Create New Dashboard. Give it a name ("SOC Security Overview"), choose Classic Dashboards (simpler for beginners) or Dashboard Studio (more modern, drag-and-drop). Add a description and set the permissions (private for now, share with your team once it's ready).
2
Add a single value panel — failed logins in last hour
Edit Dashboard → Add Panel → New from Search. Enter the SPL, select "Single Value" visualisation. This creates a big number panel — useful for KPI panels at the top of the dashboard. Set the colour thresholds: green below 50, orange 50–200, red above 200.
# Single value panel — failed logins last hour index=wineventlog EventCode=4625 earliest=-1h | stats count AS "Failed Logins"
3
Add a time chart — event volume over the last 24 hours
Add Panel → New from Search. Enter the timechart SPL. Select "Line Chart" visualisation. This shows security event volume trending over time — spikes indicate unusual activity. Set the time range to Last 24 hours.
# Line chart panel — security event volume over 24 hours index=wineventlog earliest=-24h | timechart span=30m count by EventCode limit=5
4
Add a table panel — top failed login accounts
Add Panel → New from Search. Enter the stats SPL. Select "Table" visualisation. This shows the accounts with the most failed logins in the last hour. Set to auto-refresh every 5 minutes.
# Table panel — top 10 accounts by failed logins index=wineventlog EventCode=4625 earliest=-1h | stats count AS Failures by AccountName | sort -Failures | head 10 | rename AccountName AS "Account", Failures AS "Failed Login Count"
5
Add a map panel — login geography
Add Panel → New from Search. Use iplocation to add geo data. Select "Cluster Map" visualisation. This visualises where logins are coming from geographically — dots on a world map, with size indicating volume. Immediately identifies logins from unusual countries.
# Map panel — login source locations index=wineventlog EventCode=4624 LogonType=3 earliest=-24h | iplocation IpAddress | geostats count by Country latfield=lat longfield=lon
6
Set auto-refresh and share
In dashboard settings, enable Auto Refresh (every 5 minutes is typical for a SOC overview). Change permissions from Private to App (all users in the app can see it) or Shared in App. Pin to your SOC team's home screen. Consider exporting the dashboard definition (XML) to version control.
Dashboard XML — editing the source directly

Every Splunk Classic Dashboard has an underlying XML definition. Click Edit → Edit Source to see and edit it directly. This is the fastest way to add multiple panels, copy panels between dashboards, or make bulk changes. The XML structure is straightforward:

<!-- Dashboard XML structure --> <dashboard> <label>SOC Security Overview</label> <row> <panel> <title>Failed Logins — Last Hour</title> <single> <search> <query>index=wineventlog EventCode=4625 earliest=-1h | stats count AS "Failed Logins"</query> <earliest>-1h</earliest> <latest>now</latest> <refresh>5m</refresh> </search> <option name="colorMode">block</option> <option name="rangeColors">["0x53a051","0xf8be34","0xdc4e41"]</option> <option name="ranges">[0,50,200]</option> </single> </panel> </row> </dashboard>
9. Creating and tuning alerts

Splunk alerts run a saved search on a schedule and trigger an action — email, webhook, SOAR integration, or custom script — when the results meet a defined condition. Well-written alerts are specific, high-confidence, and low-noise. Poorly written alerts create alert fatigue that makes the entire security monitoring programme less effective.

🔔
Creating an alert — step by step
Quality over quantity — fewer high-confidence alerts
Step 1 — Start with a working search

Never create an alert from a search you have not run and reviewed manually. Run the search, verify it returns what you expect, check the false positive rate, and only save it as an alert when you are confident it produces actionable results.

Step 2 — Save as Alert

After running a search: Save As → Alert. Set the alert title (use the pattern: "[SEVERITY] - [What is happening] - [Where]"), description, and permissions.

Step 3 — Set schedule and trigger condition
# Alert configuration options: Schedule: Cron expression or predefined interval Every 5 minutes: */5 * * * * Every hour: 0 * * * * Every day at 6am: 0 6 * * * Trigger Condition (choose one): - Number of results: "Trigger if number of results is greater than 0" → Use for: critical alerts where any result is an incident - Number of results: "Trigger if number of results is greater than [N]" → Use for: volume-based thresholds (>50 failed logins) - Custom condition: "Trigger when search result matches condition" → Use for: complex logic (trigger if count > 100 AND NOT in whitelist) Throttle: Suppress alert for [N] seconds after triggering Prevents alert storms from same ongoing incident Common settings: 3600 (1 hour), 86400 (24 hours)
Step 4 — Configure the trigger action

What happens when the alert fires:

  • Send email: To the SOC team distribution list. Include search results in the email body (configure via "Include search results in email"). Format: "[ALERT] Brute force detected on WORKSTATION01 — 847 failed logins in 5 minutes."
  • Webhook: POST alert data to a URL — used for SOAR integration (Splunk SOAR, XSOAR) and chat platforms (Slack, Teams). The webhook receives the alert payload as JSON and triggers a SOAR playbook.
  • Add to Triggered Alerts: Log to Splunk's triggered alerts view for analyst review.
  • Run a script: Execute a custom Python or shell script with the alert data. Used for custom integrations.
Three production-ready alert examples
# Alert 1: Brute force — 50+ failed logins from same source in 5 minutes # Schedule: every 5 minutes | Trigger: results > 0 | Throttle: 3600s index=wineventlog EventCode=4625 earliest=-5m | stats count AS failures, values(AccountName) AS accounts by IpAddress | where failures >= 50 | table IpAddress, failures, accounts # Alert 2: Office app spawning PowerShell (high confidence — almost never legitimate) # Schedule: every 5 minutes | Trigger: results > 0 | Throttle: 300s (per host) index=sysmon EventCode=1 | where match(ParentImage, "(?i)(winword|excel|outlook)\.exe") AND match(Image, "(?i)(powershell|cmd|wscript)\.exe") | table _time, host, User, ParentImage, Image, CommandLine # Alert 3: Security log cleared (always critical — no false positives) # Schedule: every 15 minutes | Trigger: results > 0 | No throttle index=wineventlog EventCode=1102 | table _time, host, SubjectUserName
Alert tuning — reducing false positives

Alert fatigue occurs when too many alerts fire with too low signal-to-noise ratio. Analysts start ignoring alerts — including real incidents. Tuning is an ongoing process:

  • Raise thresholds: If an alert fires constantly for benign activity, raise the count threshold. A brute force alert at 10 failures/5 min fires for every password-forgetting user; at 100 failures/5 min it fires only for actual brute force.
  • Add exclusions: Add NOT conditions to exclude known-good sources. Vulnerability scanners generate masses of failed login attempts — add them to an exclusion list in a lookup table rather than hardcoding IPs in the search.
  • Use lookups for whitelists: Maintain a CSV lookup of known-good IPs, known-good processes, and approved scheduled tasks. Reference the lookup in your alerts to automatically exclude approved activity.
  • Measure and review: Track false positive rate per alert monthly. Any alert with above 80% false positive rate needs tuning or retirement.
# Using a lookup for alert whitelisting # Create: /opt/splunk/etc/apps/search/lookups/approved_ips.csv # Contents: ip, reason, owner, review_date # 10.10.5.20, Vulnerability scanner, IT Security, 2027-01-01 index=wineventlog EventCode=4625 earliest=-5m | stats count AS failures by IpAddress | where failures >= 50 | lookup approved_ips ip AS IpAddress OUTPUT reason AS approved_reason | where isnull(approved_reason) # Exclude approved IPs | table IpAddress, failures
10. Splunk certifications roadmap

Splunk offers a structured certification pathway from beginner through architect level. These certifications validate real skills that employers test for in interviews and that are referenced in job postings constantly.

Splunk Core Certified User
Entry
Basic SPL searches, using the UI, field extraction, basic reports. Ideal first certification — validates foundation skills. Free Splunk Fundamentals 1 training course available online.
Splunk Core Certified Power User
Intermediate
Advanced SPL — eval, lookup, transforms.conf, advanced searches, report acceleration. This is the exam most SOC analysts should target as their first major Splunk certification.
Splunk Enterprise Certified Admin
Intermediate
Indexer and search head administration, data ingestion, index management, Splunk Web configuration. For SOC engineers who manage Splunk infrastructure as well as using it.
Splunk Enterprise Security Certified Admin
Advanced
Splunk ES-specific — CIM, correlation searches, notables, risk-based alerting, threat intelligence framework. The gold standard for Splunk-focused SOC analysts and security engineers.
Splunk SOAR Certified Automation Developer
Advanced
Splunk SOAR playbook development in Python, app building, integration development. For analysts building SOAR automation workflows.
Splunk Architect
Expert
Distributed Splunk deployment design, clustering, SmartStore, performance optimisation. For platform architects designing enterprise Splunk environments.
💡 Recommended learning path for security analysts Start with the free Splunk Fundamentals 1 course on splunk.com/training (takes about 9 hours, free). Take the Splunk Core Certified User exam (around $130 USD). Then take Splunk Fundamentals 2 and aim for Core Certified Power User. Once you have Power User, the Splunk Enterprise Security Certified Admin is the certification that will most impact your SOC analyst career — it validates the ES-specific knowledge that distinguishes a Splunk SIEM analyst from a general Splunk user.
67%
of enterprise SOC analyst job postings require Splunk/SPL
92
of the Fortune 100 use Splunk
140+
SPL commands — master 15–20 for 90% of security use cases
Free
Splunk Free tier — 500MB/day, no expiry, full SPL capability

⚡ Getting started with Splunk today

  1. Start with a TryHackMe Splunk room this week — search "Splunk" on TryHackMe and start with the "Splunk: Basics" room. It is free, requires no installation, and gives you a live Splunk instance with sample security data to practice on immediately. This is the fastest zero-to-first-search path available.
  2. Download Splunk Free and ingest your own system's logs — install Splunk on your home lab machine, install the Universal Forwarder on a Windows VM, forward the Windows Security event log, and run the security searches from Section 7. Seeing real data from your own environment makes the concepts immediately tangible.
  3. Take Splunk Fundamentals 1 (free online) — the official Splunk training course at splunk.com/training. Free, self-paced, about 9 hours. Covers everything in this tutorial and more, with hands-on exercises in a guided Splunk environment. Complete this before attempting the certification exam.
  4. Connect Splunk to your security stack — Splunk is the data layer that powers both SOAR and threat hunting. Understanding how all three work together is the foundation of modern SOC operations. SOAR guide → | Threat hunting guide →
  5. Build toward the SOC analyst role — Splunk SPL is one of the core skills listed in virtually every SOC analyst job posting. Combine it with understanding of SIEM concepts, incident response, and threat hunting to build a complete skill set. SOC analyst career guide →
Frequently asked questions
What is Splunk used for in cybersecurity?

In cybersecurity, Splunk is used as a SIEM (Security Information and Event Management) platform — collecting security logs from across an organisation's infrastructure, correlating them to detect threats, and providing search and investigation capabilities for security analysts. Specific use cases include: monitoring for failed login attempts and brute force attacks, detecting malware execution and suspicious process activity, identifying lateral movement and privilege escalation, threat hunting through historical log data, compliance reporting (collecting evidence that security controls are operating), and powering SOAR automation by providing the alert source that triggers automated playbooks. It is the most widely deployed enterprise SIEM platform globally.

What is SPL in Splunk?

SPL stands for Search Processing Language — the query language used to search and analyse data in Splunk. It is a pipeline language: you start with a search that retrieves events, then pipe the results through commands that filter, transform, and aggregate them. For example: index=wineventlog EventCode=4625 | stats count by AccountName | sort -count retrieves failed login events, counts them by account name, and sorts by count. SPL has over 140 commands, but security analysts need to master around 15–20 commands to cover the vast majority of use cases. SPL knowledge is the single most in-demand Splunk skill in SOC analyst job postings.

Is Splunk free?

Splunk offers a free tier (Splunk Free) with 500MB per day of data indexing and no time limit — sufficient for learning, home labs, and small environments. The 60-day trial provides up to 5GB per day. Splunk Enterprise (paid) has no data volume limit and adds clustering, advanced access control, and premium support. Splunk Cloud, the SaaS version, offers a 15-day free trial. For beginners, the free tier is more than sufficient to learn SPL, build dashboards, and practise with security data. TryHackMe also offers free browser-based Splunk instances with sample data for structured learning without any local installation.

How long does it take to learn Splunk?

Basic SPL search proficiency — enough to write security searches, build simple dashboards, and create alerts — takes 2–4 weeks of focused daily practice for someone with general IT or security background. The free Splunk Fundamentals 1 course (9 hours) covers the foundations. Passing the Core Certified User exam typically requires 4–6 weeks of study and practice. Becoming genuinely proficient at security-focused SPL (able to write complex threat hunting queries and build production dashboards) takes 3–6 months of daily use in a real or lab environment. The fastest path is consistent daily hands-on practice with real data — no amount of reading replaces time in the search bar.

What is the difference between Splunk and Microsoft Sentinel?

Both are enterprise SIEM platforms — Splunk is the market leader by deployment count, while Microsoft Sentinel is the fastest-growing alternative. Key differences: Splunk uses SPL (Search Processing Language) while Sentinel uses KQL (Kusto Query Language) — both are powerful but have different syntax. Splunk is available as on-premises or cloud; Sentinel is cloud-only (Azure-hosted). Sentinel is included in Microsoft 365 E5 licensing, making it effectively free for many Microsoft-centric organisations. Splunk has a larger community, more pre-built content (Splunkbase), and is historically stronger at large-scale log management. Sentinel has better native integration with Microsoft products (Entra ID, Defender, Intune, Teams). Both certifications are valued — most SOC analysts should develop proficiency in at least one, and many organisations run both.

What Splunk certification should I get first?

For most security analysts and aspiring SOC analysts, the recommended first certification is Splunk Core Certified User — it validates fundamental SPL and UI skills, costs around $130 USD, and is a prerequisite for higher certifications. After that, Splunk Core Certified Power User (advanced SPL, lookups, report acceleration) is the most valuable exam for day-to-day SOC analyst work. If your role is specifically focused on Splunk Enterprise Security (the SIEM product), the Splunk Enterprise Security Certified Admin is the highest-value credential — it validates ES-specific knowledge including correlation searches, notable events, and risk-based alerting. Start with the free Splunk Fundamentals 1 course before any exam.

About the author Written by the HOC Team at Hackers Online Club — a cybersecurity community trusted by SOC analysts, security engineers, threat hunters, and cybersecurity students since 2010. 15+ years of practical cybersecurity tutorials, SIEM guides, and security operations resources. Learn more about HOC →