

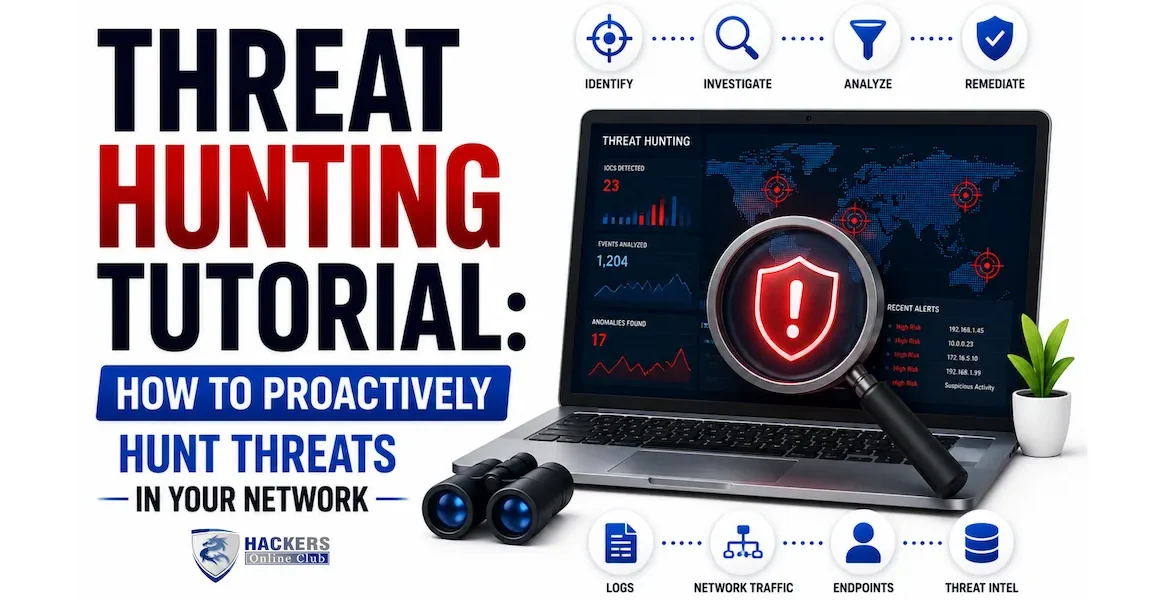
Threat Hunting Tutorial: How to Proactively Hunt Threats in Your Network (2026)

Threat hunting tutorial
By HOC Team  |  Last updated: July 2026  |  Read time: ~22 min

In August 2022, Mandiant's incident response team was called in after a financial services firm discovered ransomware on several systems.

During the investigation, they found something unexpected in the log telemetry: the attacker had been in the environment for 11 months before deploying ransomware. During those 11 months, the SIEM had generated no alerts.

Not because the attacker was invisible — they had accessed hundreds of systems, used legitimate tools like PsExec and PowerShell, and exfiltrated gigabytes of data. But none of those activities matched the SIEM's alert rules, because alert rules are written for known attack patterns, and this attacker's specific behaviour pattern was not one of them.

This is the gap that threat hunting fills. Alert-based detection — SIEM correlation rules, EDR signatures, IDS signatures — is reactive and pattern-dependent. It catches what it was programmed to catch, which is always a subset of what attackers actually do. Threat hunting is the proactive, analyst-driven search through collected telemetry for evidence of compromise that automated detection missed. It is not about replacing SIEM and EDR — it is about covering the gap between what those tools are configured to detect and what is actually happening in the environment.

This tutorial covers the complete threat hunting methodology from hypothesis generation through investigation to detection engineering, with practical query examples in Splunk SPL and Microsoft KQL, an ATT&CK-mapped hunting library, and a guide to building a threat hunting programme from scratch.

📊 Threat hunting — 2026 key numbers Average attacker dwell time in environments without threat hunting: 204 days · Average dwell time in environments with active threat hunting programme: 24 days · 61% of threat hunts that produce a finding result in a previously unknown compromise (SANS 2025) · Top threat hunting skill in SOC analyst job postings: Splunk SPL (67%), KQL (54%), MITRE ATT&CK knowledge (89%)
1. What is threat hunting and how it differs from alert monitoring

Threat hunting is the proactive, hypothesis-driven search through security telemetry for indicators of adversary activity that has not been detected by automated security controls. It is human-led, iterative, and intelligence-informed — an analyst forms a hypothesis about how an attacker might be operating in the environment, then searches the data to confirm or refute that hypothesis.

This is fundamentally different from alert monitoring, which is reactive — waiting for a rule to fire, then investigating the alert. Alert monitoring catches known attack patterns. Threat hunting finds unknown or novel attacker activity by asking: "If an attacker were using technique X in our environment, what evidence would they leave in our logs, and can I find it?"

🔍
Alert monitoring vs threat hunting — the critical difference
DimensionAlert monitoring (reactive)Threat hunting (proactive)
TriggerAlert fires → analyst investigatesAnalyst forms hypothesis → searches data
What it findsKnown attack patterns the rule was written forNovel, unknown, or evasive activity the rules missed
Who drives itThe SIEM and EDR configurationThe analyst's knowledge, creativity, and threat intelligence
Attacker advantageAttackers who study your rules can evade themAttackers cannot predict what a creative analyst will search for
OutputAlert ticket for triageFinding (new compromise) OR new detection rule
When it runsContinuously, automaticallyScheduled hunt cadence or triggered by threat intelligence
Skill requiredAlert triage and investigationData analysis, threat intelligence, adversary knowledge, query writing
Dwell time impactCatches common attacks fastDramatically reduces dwell time for sophisticated attackers
Threat hunting is not a replacement for SIEM and EDR. You need both. SIEM and EDR catch the high-volume, common attacks automatically and without analyst effort. Threat hunting covers the gap — the sophisticated, patient, low-and-slow attackers who specifically evade automated detection. A hunt that finds nothing is still valuable: it gives you higher confidence that your environment does not contain that specific threat. The absence of evidence is meaningful data when the hunt was well-designed.
Threat hunting cycle — from hypothesis to detection engineering and back
Threat Hunting Cycle — Hypothesis to Detection Engineering THREAT HUNTING CYCLE ① HYPOTHESIS Threat intelligence feeds MITRE ATT&CK mapping Industry reports (CISA, Mandiant) Previous hunt findings Attacker TTPs for your sector ② INVESTIGATION SIEM search (SPL / KQL) EDR threat hunt queries Network flow analysis Log correlation across sources Baseline comparison ③ ANALYSIS Anomaly vs baseline Triage findings Confirm / refute hypothesis Escalate true positives ④ DETECTION ENG. Convert findings → SIEM rules Add IOCs to blocklists Update ATT&CK coverage map Document for next hunt cycle SIEM · EDR Network logs · DNS Threat intel ATT&CK TTPs
2. The Pyramid of Pain — hunting at the right level

David Bianco's Pyramid of Pain is essential context for threat hunting. It describes the relationship between the types of indicators defenders use and the pain those indicators cause attackers when defenders detect and respond to them. Hunting at the top of the pyramid is dramatically more effective than hunting at the bottom.

🔺
Pyramid of Pain — hunt at TTPs for maximum impact
Top = hardest for attacker to change
TTPs (Tactics, Techniques, Procedures)
Tough — ATT&CK techniques. Changing TTPs means retraining, rebuilding tools, changing attacker behaviour. Finding TTPs = finding the attacker's playbook. This is where mature threat hunting operates.
Tools (specific software attackers use)
Challenging — Finding Mimikatz, Cobalt Strike, custom RATs. Attacker must rebuild or replace the tool. High value but attackers can recompile or obfuscate.
Network/Host artefacts
Annoying — Specific registry keys, file paths, mutex names, named pipes. Attacker must change code or configuration. Still useful for hunting known malware families.
Domain names
Simple — Attacker registers a new domain in minutes. IOC-based hunting on domains is useful for known campaigns but low impact on sophisticated attackers.
IP addresses
Easy to change — New IP in minutes. IP blocklists are valuable but trivially bypassed. Do not build a hunt programme around IP IOCs alone.
Hash values
Trivial to change — Recompile the binary, change one byte. Hash-based detection is caught immediately by recompiling. Useful as a starting point, not as a hunt focus.

The practical implication: spend most of your hunting effort at the TTP and tool level. When you find a malicious hash, immediately pivot to what that malware does — the registry keys it writes, the processes it spawns, the network patterns it creates. These behavioural indicators are what your next hunt should look for across the rest of the fleet, because the attacker can change the hash but cannot easily change their behaviour pattern.

3. Threat hunting methodology — the four-phase cycle
🗺
The PEAK threat hunting framework
Prepare, Execute, Act, Know
P
Prepare — Define the hunt before running a single query
Every hunt starts with a written hypothesis statement: "I believe [threat actor / technique] may be present in our environment, evidenced by [observable behaviour], which I will look for in [specific data sources]." Without a written hypothesis, searches become aimless. Define: what you are looking for, why you believe it might exist, which data sources contain relevant evidence, what a positive finding looks like, and what query or search approach you will use. Document this before touching a SIEM.
E
Execute — Search the data systematically
Run your queries against the relevant data sources. Start broad to understand the data landscape, then narrow based on what you find. Look for anomalies — things that deviate from the established baseline for that system, user, or network segment. Compare current behaviour against historical norms. The goal is not to find a specific file or IP — it is to find behavioural evidence of the technique you hypothesised. Document every query you run, the result count, and what you observed.
A
Act — Triage findings and escalate or close
For every finding: determine whether it is a true positive (malicious activity), a false positive (legitimate activity that looks suspicious), or inconclusive (requires more data). True positives become incidents — hand off to the IR team using your incident response process. False positives provide tuning intelligence — document the legitimate behaviour so future hunts can exclude it. Inconclusive findings guide the next hunt iteration. Do not close a hunt until you have documented every finding and its disposition.
K
Know — Convert findings into durable improvements
Every completed hunt should produce at least one of these outputs: a new or improved SIEM detection rule (if the hunt found malicious activity or identified a detection gap), an updated baseline (if the hunt revealed legitimate behaviour previously unknown), a documentation update (record what was searched, what was found, and what was excluded), or a new hypothesis for the next hunt (hunts always generate follow-up questions). A hunt that produced no finding but was well-designed is still valuable — document the negative result so future hunters know this was checked.
4. Generating hypotheses — three methods

The quality of a threat hunt is limited by the quality of its hypothesis. A vague hypothesis ("look for suspicious activity") produces nothing useful. A specific, testable hypothesis drives a focused, productive hunt.

💡
Three hypothesis generation methods
Use all three for full coverage
Method 1 — Intelligence-driven hypotheses

Use threat intelligence to generate hypotheses about what is most likely targeting your environment right now. Sources:

  • CISA Known Exploited Vulnerabilities (KEV) catalogue — cisa.gov/known-exploited-vulnerabilities. If a vulnerability appears here, threat actors are actively exploiting it. Hunt for exploitation evidence in your logs immediately.
  • Sector-specific threat reports — Mandiant, CrowdStrike, Microsoft threat intelligence all publish regular reports on threats targeting specific sectors. "Financial sector targeted by APT41 using T1059.001" → generate a hypothesis around PowerShell execution patterns.
  • ISAC threat intelligence — your industry's Information Sharing and Analysis Center (FS-ISAC, H-ISAC, E-ISAC) shares TTPs specific to your sector, often hours or days before public disclosure.
  • Newly disclosed CVEs affecting your stack — when a critical CVE drops for software you run, assume exploitation attempts are already occurring and hunt for exploitation evidence before waiting for an alert to fire.
Method 2 — ATT&CK-driven hypotheses

Use the MITRE ATT&CK framework to systematically generate hypotheses for techniques you may not have detection coverage for. Process:

  1. Map your current SIEM and EDR detections to ATT&CK techniques
  2. Identify techniques used by threat actors that target your sector for which you have no detection coverage
  3. Generate a hypothesis for each coverage gap: "If an attacker used T1003.001 (LSASS Memory dumping) in our environment, they would... and I can look for this in..."
  4. Prioritise by likelihood (common techniques used against your sector) and impact (techniques with the most damaging potential)
Method 3 — Baseline anomaly hypotheses

Establish normal behaviour baselines for key systems and users, then hunt for deviations. This method finds attacks that do not match any known technique because the anomaly itself is the indicator.

  • Frequency analysis — "Which user accounts logged in more than 50 times outside business hours last month?" establishes a count-based anomaly baseline
  • Rarity analysis — "Which processes ran on only 1–2 hosts in the last 30 days?" — rare processes on a small number of hosts are more suspicious than common ones
  • Temporal analysis — "Which services started for the first time ever in the last 7 days?" — new services are high-value hunting targets
  • Peer comparison — "Which hosts in the finance VLAN generated outbound traffic 10x more than the average of their peers?" — outliers in a peer group are suspicious
Hypothesis template — fill before every hunt
HUNT HYPOTHESIS TEMPLATE Hunt ID: TH-2026-[sequential] Date: [date] Hunter: [name] ATT&CK technique: T[XXXX.XXX] — [technique name] HYPOTHESIS STATEMENT: "I believe [threat actor type / specific actor] may be using [specific technique] in our environment, based on [intelligence source / ATT&CK coverage gap / baseline anomaly]. If present, this activity would leave evidence in [specific log source(s)] in the form of [observable pattern]." EXAMPLE — Completed hypothesis: "I believe an attacker may be using T1059.001 (PowerShell) with encoded commands to execute malicious code. Based on recent Mandiant reporting on FIN7 activity targeting retail. If present, this would appear in Windows Security Event 4688 (process creation) logs as PowerShell.exe launched with -EncodedCommand or -enc flags from Office application parent processes. I will search Splunk for parent-child process relationships where WINWORD.exe, EXCEL.exe, or OUTLOOK.exe spawned PowerShell with encoded command arguments." DATA SOURCES: [Windows Event 4688 / Sysmon EID 1 / EDR telemetry] TIME RANGE: [last 30 days] SUCCESS CRITERIA: [What a true positive looks like] EXPECTED OUTPUT: Finding / New detection rule / Negative result
5. Data sources and log requirements

You can only hunt in data you have collected. Before building a hunt programme, audit your log coverage against the data sources that matter most for each ATT&CK tactic. Gaps in log coverage are gaps in your hunting capability.

Data sourceKey events for huntingATT&CK tactics coveredPriority
Windows Security Events4624/4625 (logon), 4688 (process creation), 4698/4702 (scheduled task), 4720/4728 (account changes), 4776 (NTLM auth), 1102 (log cleared)Initial Access, Privilege Escalation, Lateral Movement, Persistence, Defence Evasion⭐⭐⭐⭐⭐ Critical
Sysmon (Windows)EID 1 (process creation with full cmdline), EID 3 (network connection), EID 7 (image load), EID 8 (CreateRemoteThread), EID 11 (file create), EID 13 (registry value set)All tactics — Sysmon provides richer data than native Windows logging for almost every technique⭐⭐⭐⭐⭐ Critical (deploy if not already)
EDR telemetryProcess tree, command line arguments, file operations, network connections, registry changes, memory operations — all with process lineageAll tactics — the single richest endpoint data source⭐⭐⭐⭐⭐ Critical
PowerShell loggingModule logging (all loaded modules), Script Block logging (all executed code, including decoded), Transcription (session transcript)Execution (T1059.001) — essential for PowerShell-based attacks⭐⭐⭐⭐⭐ Critical — enable if not already
DNS logsAll DNS queries from all hosts — query name, type, resolver, responseCommand and Control (C2 via DNS), Exfiltration (DNS tunnelling)⭐⭐⭐⭐⭐ Critical
Network flow / firewallSource/dest IP, port, bytes transferred, duration, protocol, actionLateral Movement, Exfiltration, C2⭐⭐⭐⭐ High
Authentication (IdP)All sign-ins, MFA events, Conditional Access decisions, risk scores, impossible travel flagsInitial Access (credential attacks), Lateral Movement⭐⭐⭐⭐ High
Cloud API logsAWS CloudTrail, Azure Activity Log, GCP Audit Logs — all API calls, IAM changes, configuration changesDiscovery, Privilege Escalation, Persistence (in cloud environments)⭐⭐⭐⭐ High (if cloud workloads)
Web proxy / HTTPURLs visited, user agent, response codes, bytes transferred, referrerC2, Exfiltration, Initial Access (drive-by download)⭐⭐⭐ Medium
Email headers and metadataSender, recipient, subject, attachment hashes, URLs, authentication results (SPF, DKIM, DMARC)Initial Access (T1566 — Phishing)⭐⭐⭐ Medium
💡 Enable PowerShell Script Block Logging — it is a game changer PowerShell Script Block Logging (enabled via Group Policy: Administrative Templates → Windows Components → Windows PowerShell) records the actual decoded content of every PowerShell script that executes — including scripts that use Base64 encoding or other obfuscation. Without this, you only see the encoded command and cannot know what it actually did. With it, every PowerShell execution is fully readable in the Windows event log (Event ID 4104). This single control adds enormous hunting coverage for a large class of attacks. Enable it on all Windows systems immediately if not already active.
6. Threat hunt library — 8 ready-to-run hunts with queries

The following hunts are designed to be run immediately in environments with the required data sources. Each hunt includes the hypothesis, the observable evidence, and both Splunk SPL and KQL queries.

H1
Office applications spawning shells — T1566 + T1059
Hypothesis: A phishing document has been opened and executed a macro that launched a shell process. Evidence: Office process (Word, Excel, Outlook) as parent of PowerShell, CMD, WScript, or CScript.
High confidence — very rarely legitimate
Splunk SPL
# Hunt: Office apps spawning shell processes # Data: Sysmon EID 1 or Windows Event 4688 (with command line audit) index=sysmon EventCode=1 | where (like(ParentImage, "%winword.exe") OR like(ParentImage, "%excel.exe") OR like(ParentImage, "%outlook.exe") OR like(ParentImage, "%powerpnt.exe")) AND (like(Image, "%powershell.exe") OR like(Image, "%cmd.exe") OR like(Image, "%wscript.exe") OR like(Image, "%cscript.exe") OR like(Image, "%mshta.exe") OR like(Image, "%rundll32.exe")) | table _time, ComputerName, User, ParentImage, Image, CommandLine | sort -_time # Any result here warrants immediate investigation
KQL (Microsoft Sentinel / Defender Advanced Hunting)
// Hunt: Office apps spawning shells — KQL DeviceProcessEvents | where InitiatingProcessFileName in~ ("winword.exe","excel.exe", "outlook.exe","powerpnt.exe","mspub.exe") and FileName in~ ("powershell.exe","cmd.exe","wscript.exe", "cscript.exe","mshta.exe","rundll32.exe") | project Timestamp, DeviceName, AccountName, InitiatingProcessFileName, FileName, ProcessCommandLine | order by Timestamp desc
H2
PowerShell with encoded commands — T1059.001
Hypothesis: An attacker is using Base64-encoded PowerShell commands to hide malicious activity. Evidence: PowerShell.exe launched with -EncodedCommand, -enc, or -e flags containing a Base64 string.
Common technique — high hit rate in most environments
Splunk SPL
# Hunt: PowerShell encoded commands # Decode the Base64 to see what was actually executed # Enable Script Block logging (EID 4104) for decoded content index=wineventlog OR index=sysmon (EventCode=4688 OR EventCode=1) | where like(Image, "%powershell.exe") OR like(Process_Name, "%powershell.exe") | where match(CommandLine, "(?i)(-enc|-encodedcommand|-ec)\s+[A-Za-z0-9+/=]{20,}") | eval encoded_cmd = mvindex(split(lower(CommandLine), "-enc"), 1) | eval encoded_cmd = mvindex(split(encoded_cmd, " "), 1) | table _time, ComputerName, User, CommandLine, ParentImage | sort -_time # Also hunt for decoded content via Script Block Logging (4104) # This shows the actual decoded PowerShell being executed index=wineventlog EventCode=4104 | where match(ScriptBlockText, "(?i)(invoke-mimikatz|invoke-shellcode|IEX|Invoke-Expression|downloadstring|bypass|hidden|noprofile)") | table _time, ComputerName, ScriptBlockText | sort -_time
KQL (Microsoft Sentinel)
// Hunt: PowerShell encoded commands and suspicious script blocks DeviceProcessEvents | where FileName =~ "powershell.exe" and ProcessCommandLine matches regex @"(?i)(-enc|-encodedcommand|-ec)\s+[A-Za-z0-9+/=]{20,}" | project Timestamp, DeviceName, AccountName, ProcessCommandLine, InitiatingProcessFileName | order by Timestamp desc // Hunt decoded script block content SecurityEvent | where EventID == 4104 | where EventData has_any ("Invoke-Mimikatz","IEX","DownloadString", "bypass","FromBase64String","Invoke-Shellcode") | project TimeGenerated, Computer, EventData | order by TimeGenerated desc
H3
LSASS credential dumping — T1003.001
Hypothesis: An attacker is dumping credentials from LSASS memory using Mimikatz, ProcDump, or built-in Windows tools. Evidence: Process accessing lsass.exe memory, or lsass.exe writing dump files.
Critical severity if found — escalate immediately
Splunk SPL
# Hunt 3A: Processes accessing LSASS memory # Requires Sysmon EID 10 (ProcessAccess) — enable if not already index=sysmon EventCode=10 | where like(TargetImage, "%lsass.exe") AND NOT (like(SourceImage, "%MsMpEng.exe") OR like(SourceImage, "%csrss.exe") OR like(SourceImage, "%werfault.exe") OR like(SourceImage, "%taskmgr.exe")) | table _time, ComputerName, SourceImage, SourceUser, TargetImage, GrantedAccess | sort -_time # Hunt 3B: ProcDump or Task Manager creating LSASS dump files index=sysmon EventCode=11 | where like(TargetFilename, "%.dmp") AND (like(Image, "%procdump%") OR like(Image, "%taskmgr.exe") OR like(Image, "%rundll32.exe")) | table _time, ComputerName, User, Image, TargetFilename
KQL
// Hunt: LSASS access from suspicious processes DeviceEvents | where ActionType == "OpenProcessApiCall" and FileName =~ "lsass.exe" and InitiatingProcessFileName !in~ ("MsMpEng.exe","csrss.exe", "werfault.exe","taskmgr.exe","svchost.exe") | project Timestamp, DeviceName, AccountName, InitiatingProcessFileName, InitiatingProcessCommandLine | order by Timestamp desc
H4
Lateral movement via PsExec / WMI / SMB — T1021
Hypothesis: An attacker is moving laterally using PsExec, WMI remote execution, or direct SMB connections to spread through the network. Evidence: PSEXESVC service creation, WMI remote execution events, rapid sequential logons from same source to multiple destinations.
Key indicator of attacker progression — hunt this weekly
Splunk SPL
# Hunt 4A: PsExec detection via PSEXESVC service creation index=wineventlog EventCode=7045 | where ServiceName="PSEXESVC" | table _time, ComputerName, ServiceName, ServiceFileName, AccountName # Hunt 4B: Lateral movement — same account, multiple dest hosts rapidly index=wineventlog EventCode=4624 LogonType=3 | bucket span=10m _time | stats dc(ComputerName) as unique_hosts, values(ComputerName) as hosts by _time, SourceNetworkAddress, AccountName | where unique_hosts >= 5 # Same account touching 5+ hosts in 10 minutes = suspicious lateral movement | sort -unique_hosts | table _time, AccountName, SourceNetworkAddress, unique_hosts, hosts # Hunt 4C: WMI remote execution index=sysmon EventCode=1 | where ParentImage="C:\\Windows\\System32\\wbem\\WmiPrvSE.exe" AND (like(Image, "%cmd.exe") OR like(Image, "%powershell.exe") OR like(Image, "%mshta.exe")) | table _time, ComputerName, User, Image, CommandLine
KQL
// Hunt: Rapid lateral movement — same account, many hosts SecurityEvent | where EventID == 4624 and LogonType == 3 | summarize UniqueComputers = dcount(Computer), Computers = make_set(Computer) by bin(TimeGenerated, 10m), Account, IpAddress | where UniqueComputers >= 5 | order by UniqueComputers desc // Hunt: WMI spawning shells (remote execution) DeviceProcessEvents | where InitiatingProcessFileName =~ "WmiPrvSE.exe" and FileName in~ ("cmd.exe","powershell.exe","mshta.exe","wscript.exe") | project Timestamp, DeviceName, AccountName, FileName, ProcessCommandLine | order by Timestamp desc
H5
DNS exfiltration / C2 beaconing — T1071.004 + T1048.003
Hypothesis: Malware is using DNS queries to exfiltrate data or communicate with a C2 server. Evidence: High-volume DNS queries to a single domain, long subdomain strings (data encoded in subdomain), or periodic DNS queries at regular intervals.
Evasive technique — missed by most alert rules
Splunk SPL
# Hunt 5A: DNS tunnelling — unusually long subdomain strings # Data: DNS server logs or network capture with DNS parsed index=dns | eval subdomain_length = len(mvindex(split(query, "."), 0)) | where subdomain_length > 50 # Legitimate domains rarely have 50+ char subdomains | stats count by query, src_ip, subdomain_length | sort -subdomain_length # Hunt 5B: C2 beaconing — regular periodic DNS to same domain index=dns | bucket span=1h _time | stats count by _time, src_ip, query | eventstats avg(count) as avg_count, stdev(count) as stdev_count by src_ip, query | eval regularity = abs(count - avg_count) / (stdev_count + 0.001) | where regularity < 0.3 AND avg_count > 10 # Very regular (low stdev) + high frequency = beaconing pattern | table src_ip, query, avg_count, regularity | sort regularity
H6
New scheduled tasks and services — T1053 + T1543
Hypothesis: An attacker has established persistence via a new scheduled task or Windows service. Evidence: Scheduled task or service created by a non-standard process, pointing to an unusual executable path.
Persistence indicator — run weekly as baseline hunt
Splunk SPL
# Hunt: New scheduled tasks created in last 7 days index=wineventlog (EventCode=4698 OR EventCode=4702) | eval task_details = TaskName + " | " + TaskContent | where NOT (like(SubjectUserName, "%SYSTEM") OR like(SubjectUserName, "%LOCAL SERVICE") OR like(SubjectUserName, "%NETWORK SERVICE")) # Filter known good — tasks created by USER accounts are more suspicious than SYSTEM | table _time, ComputerName, SubjectUserName, TaskName, TaskContent | sort -_time # Hunt: New Windows services installed index=wineventlog EventCode=7045 | where NOT (like(ServiceFileName, "%\\Windows\\%") OR like(ServiceFileName, "%\\Program Files\\%")) # Services installed outside standard paths are suspicious | table _time, ComputerName, AccountName, ServiceName, ServiceFileName, ServiceType | sort -_time
H7
Impossible travel and credential attacks — T1078 + T1110
Hypothesis: An account has been compromised and is being used from an attacker-controlled location. Evidence: Successful logins from two geographically incompatible locations within a short window, or account accessing systems it has never accessed before.
Identity hunting — critical for detecting credential compromise
Splunk SPL
# Hunt: Impossible travel — same user, two countries, within 60 min index=azure_ad OR index=okta action=success | iplocation src_ip | bucket span=1h _time | stats dc(Country) as country_count, values(Country) as countries, values(src_ip) as ips by _time, user | where country_count >= 2 | table _time, user, country_count, countries, ips # Hunt: First-time access to admin systems by non-admin users index=wineventlog EventCode=4624 LogonType=3 earliest=-24h | stats dc(ComputerName) as new_systems, values(ComputerName) as systems by AccountName | join AccountName [search index=wineventlog EventCode=4624 LogonType=3 earliest=-30d latest=-24h | stats values(ComputerName) as historical_systems by AccountName] | eval new_accesses = mvfilter(NOT match(systems, historical_systems)) | where isnotnull(new_accesses) | table AccountName, new_accesses
H8
Large data staging and exfiltration — T1074 + T1041
Hypothesis: An attacker is staging data for exfiltration, compressing sensitive files, or sending large volumes of data to external destinations. Evidence: Unusual outbound data volumes, compression tools run against file shares, unusual cloud upload activity.
Exfiltration hunting — run before any incident is declared
Splunk SPL
# Hunt 8A: Outlier hosts by outbound bytes — statistical anomaly index=firewall direction=outbound action=allowed | stats sum(bytes_out) as total_out by src_ip | eventstats avg(total_out) as avg_out, stdev(total_out) as sd_out | eval z_score = (total_out - avg_out) / (sd_out + 1) | where z_score > 3 # Z-score > 3 means this host sent 3 standard deviations more than average | sort -z_score | table src_ip, total_out, avg_out, z_score # Hunt 8B: Archiving tools used on file servers (staging behaviour) index=sysmon EventCode=1 | where (like(Image, "%7z.exe") OR like(Image, "%winrar.exe") OR like(Image, "%zip%")) AND (like(CommandLine, "%\\\\%") OR like(CommandLine, "%share%") OR like(CommandLine, "%c:\\users%\\documents%")) # Archiving tools targeting network shares or user document folders | table _time, ComputerName, User, Image, CommandLine
7. Hunting with Splunk — SPL query guide
🔶
Essential Splunk SPL patterns for threat hunting
The commands every threat hunter needs
Pattern 1 — Frequency baseline and outlier detection
# Find statistical outliers — hosts or users deviating from normal index=wineventlog EventCode=4625 earliest=-7d | stats count by ComputerName | eventstats avg(count) as avg_count, stdev(count) as sd | eval z_score = (count - avg_count) / (sd + 0.001) | where z_score > 2.5 | sort -z_score # Hosts with failed logon counts > 2.5 standard deviations above average
Pattern 2 — Rarity analysis (find rare processes)
# Rare binary execution — processes running on fewer than 5 hosts # Legitimate software runs on many hosts; attacker tools often run on very few index=sysmon EventCode=1 earliest=-30d | stats dc(ComputerName) as host_count, values(ComputerName) as hosts, values(User) as users by Image | where host_count <= 3 | where NOT (like(Image, "%\\Windows\\%") OR like(Image, "%\\Program Files\\%")) | sort host_count | table Image, host_count, hosts, users
Pattern 3 — Time series analysis (detect beaconing)
# Detect periodic connections (beaconing) — regular intervals = C2 index=network dest_port!=443 earliest=-24h | table _time, src_ip, dest_ip, dest_port | sort src_ip, dest_ip, _time | streamstats window=2 current=false last(_time) as prev_time by src_ip, dest_ip | eval interval = _time - prev_time | stats avg(interval) as avg_interval, stdev(interval) as sd_interval, count by src_ip, dest_ip, dest_port | where count > 20 AND sd_interval < 30 AND avg_interval < 3600 # Low standard deviation = very regular timing = beaconing | sort sd_interval
Pattern 4 — Stack ranking (find the bottom of the list)
# Stack counting: common things appear at the top; rare anomalies at bottom # Sort ascending to find rare events (attackers are often rare) index=wineventlog EventCode=4688 earliest=-30d | stats count by Process_Name, ParentProcessName | sort count # Look at the bottom 50 rows — rare parent-child combinations are hunting gold | head 50
Pattern 5 — Join for cross-source correlation
# Find users who both ran PowerShell AND had unusual auth activity same day index=sysmon EventCode=1 earliest=-7d | where like(Image, "%powershell.exe") AND like(CommandLine, "%-enc%") | stats count as ps_count by User, ComputerName, _time | join User [search index=wineventlog EventCode=4625 earliest=-7d | stats count as fail_count by AccountName | rename AccountName as User] | where fail_count > 10 | table User, ComputerName, ps_count, fail_count
8. Hunting with KQL — Microsoft Sentinel / Defender guide
🔷
KQL threat hunting patterns — Microsoft Sentinel and Defender XDR
Kusto Query Language essentials
KQL hunting fundamentals
// KQL threat hunting — key operators // 1. Time filtering — always scope your hunt SecurityEvent | where TimeGenerated > ago(7d) // 2. String matching | where ProcessName has "powershell" // case-insensitive contains | where CommandLine contains "encodedcommand" // also case-insensitive | where CommandLine matches regex @"(?i)-enc\s+" // 3. Aggregation — count by dimension | summarize Count = count(), Users = make_set(Account), Computers = make_set(Computer) by bin(TimeGenerated, 1h), EventID // 4. Join across tables SecurityEvent | where EventID == 4624 | join kind=inner ( SecurityEvent | where EventID == 4625 | summarize FailCount = count() by Account ) on Account | where FailCount > 10
KQL hunt — defence evasion (timestomping, log clearing)
// Hunt: Security log cleared (Event 1102) — attacker covering tracks SecurityEvent | where EventID == 1102 | project TimeGenerated, Computer, Account, Activity | order by TimeGenerated desc // Any result here is critical — security log should almost never be cleared // Hunt: Audit policy changes (Event 4719) — attacker disabling logging SecurityEvent | where EventID == 4719 | project TimeGenerated, Computer, Account, SubcategoryGuid, AuditPolicyChanges | order by TimeGenerated desc
KQL hunt — discovery activities (attacker reconnaissance)
// Hunt: Rapid AD enumeration — many LDAP queries in short window // Data: Windows Event 4662 (directory service object accessed) SecurityEvent | where EventID == 4662 and ObjectType == "organizationalUnit" or ObjectType == "user" | summarize QueryCount = count(), UniqueObjects = dcount(ObjectName) by bin(TimeGenerated, 5m), SubjectUserName, Computer | where QueryCount > 100 | order by QueryCount desc // Hunt: Net commands for AD reconnaissance DeviceProcessEvents | where FileName =~ "net.exe" or FileName =~ "net1.exe" and ProcessCommandLine has_any ("user","group","localgroup", "accounts","share","view","session") | summarize count(), Commands = make_set(ProcessCommandLine) by bin(Timestamp, 10m), DeviceName, AccountName | where count_ > 5 | order by count_ desc
9. MITRE ATT&CK driven hunting — building coverage

MITRE ATT&CK provides a structured taxonomy of adversary techniques across 14 tactics. Using it as a hunting framework lets you measure and improve your coverage systematically rather than hunting randomly.

🗺
ATT&CK-driven hunt prioritisation — where to focus first
High-frequency techniques for most sectors
Priority hunting targets by frequency of use
ATT&CK TechniqueIDWhy it mattersKey log sourceHunt priority
PowerShell executionT1059.001Used in 89% of malware campaigns; encoded commands evade basic loggingPS Script Block logging (EID 4104), Sysmon EID 1⭐⭐⭐⭐⭐
Valid accounts (credential abuse)T1078#1 initial access vector — stolen credentials, brute force successAzure AD / Okta sign-in logs, EID 4624⭐⭐⭐⭐⭐
LSASS memory dumpT1003.001Used by Mimikatz, ProcDump — enables lateral movement via pass-the-hashSysmon EID 10 (ProcessAccess)⭐⭐⭐⭐⭐
Lateral movement via SMB/PsExecT1021.002Primary lateral movement method for ransomware groupsEID 7045 (service install), EID 4624 Type 3⭐⭐⭐⭐⭐
Scheduled task persistenceT1053.005Most common persistence mechanism — survives rebootsEID 4698/4702, Sysmon EID 1⭐⭐⭐⭐⭐
OS credential dumpingT1003Enables lateral movement — hunting this disrupts attacker progressionSysmon EID 10, EID 4688⭐⭐⭐⭐
Ingress tool transferT1105Attackers download additional tools — PowerShell WebClient, certutil, curlSysmon EID 1 (cmdline), proxy logs⭐⭐⭐⭐
DNS-based C2T1071.004Evasive C2 channel — passes through most firewalls, often unmonitoredDNS server logs⭐⭐⭐⭐
Data staged for exfiltrationT1074Attacker collecting data before exfiltration — last chance to catch before lossSysmon EID 1 (archive tools), network flow⭐⭐⭐⭐
WMI remote executionT1047LOtL technique — WMI is legitimate, but remote WMI spawning shells is notSysmon EID 1 (parent=WmiPrvSE.exe)⭐⭐⭐
Building your ATT&CK coverage map

The ATT&CK Navigator (attack.mitre.org/resources/navigator) allows you to colour-code techniques based on your detection and hunting coverage. Build your coverage map in three layers:

  • Red — no coverage: Techniques for which you have neither automated detection rules nor hunt coverage. Highest priority for your hunting programme.
  • Yellow — hunt coverage only: Techniques you hunt for periodically but have no automated alert rule. Valuable but dependent on hunting frequency.
  • Green — automated detection: Techniques covered by SIEM or EDR rules that alert automatically. Continue to hunt these to validate rule effectiveness.
Focus on the techniques used by threat actors targeting your sector. ATT&CK groups (attack.mitre.org/groups) documents which specific techniques each known threat actor uses. Find the threat actors most relevant to your industry and geographic region, map their techniques, and build your hunting programme around detecting those specific TTPs. A healthcare organisation should prioritise the techniques used by groups known to target healthcare — not the full 700+ technique matrix.
10. Building a threat hunting programme
Level 0
Initial
Alert-driven only. No proactive hunting. Reactive to SIEM alerts. Dwell time: 204+ days.
Level 1
Minimal
Ad-hoc hunting after incidents. IOC-based searches. Basic SPL/KQL capability. Occasional scheduled hunts.
Level 2
Developing
Regular scheduled hunts. Hypothesis-driven. ATT&CK aligned. Hunt documentation and process. 2+ dedicated hunters.
Level 3
Managed
Dedicated hunt team. Intelligence-driven hypotheses. ATT&CK coverage measured. Findings drive new detections. Dwell time: under 30 days.
Level 4
Optimised
Automated hunt pipelines. Full ATT&CK coverage. Threat intel integration. Continuous hypothesis generation. Dwell time: under 24 hours.
🏗
Building your programme — practical steps by level
Getting from Level 0 to Level 2 (6–12 months)
  • Week 1–2: Enable critical log sources not yet collected — PowerShell Script Block Logging, Sysmon deployment, DNS logging. Without these, many of the hunts in this guide cannot run.
  • Month 1: Run the 8 hunts in Section 6 against your environment. Document every finding and every data gap discovered. This baseline establishes your current threat posture and identifies data collection gaps simultaneously.
  • Month 2–3: Map your existing SIEM detections to ATT&CK. Identify your top 20 uncovered techniques. Generate hypotheses for each. Schedule one hunt per week.
  • Month 3–6: Build a hunt log — a spreadsheet tracking every hunt run, the hypothesis, the data sources queried, the findings, and the disposition. This creates institutional knowledge and prevents repeating the same hunt unnecessarily.
  • Month 6–12: Convert every finding into a detection rule. Subscribe to 2–3 threat intelligence sources relevant to your sector. Integrate intelligence into hypothesis generation.
Team structure — who hunts?
  • Small organisations (1 SOC analyst): Dedicate 20% of SOC analyst time (1 day per week) to proactive hunting. Use the scheduled hunt list — run one hunt from the library per week on a rotating basis.
  • Medium organisations (3–5 SOC analysts): Designate one Tier 2 analyst as the primary threat hunter, rotating monthly. This analyst owns the hunt programme, maintains the hunt log, and runs 2–3 hunts per week.
  • Large organisations (dedicated SOC): Dedicated threat hunting team of 2–4 hunters with no alert triage responsibilities. Intelligence-driven programme with structured hypothesis management and ATT&CK coverage tracking.
Measuring hunt programme effectiveness
  • Mean Time to Hunt (MTTH): How long between a new threat technique becoming known and your first hunt covering it? Target under 7 days for critical techniques.
  • Detection conversion rate: Percentage of completed hunts that resulted in a new or improved detection rule. A healthy programme converts 30–50% of hunts into new detections.
  • True positive rate: Percentage of hunts that found actual malicious activity vs false positives. Tracks hypothesis quality over time.
  • ATT&CK coverage percentage: Percentage of techniques relevant to your threat model with at least hunt coverage. Track monthly — this number should increase over time.
  • Dwell time reduction: The ultimate metric. How long are attackers in your environment before being found? This should decrease as the hunt programme matures.
204d
avg attacker dwell time without threat hunting
24d
avg dwell time with active threat hunting programme
61%
of hunts that find something discover a previously unknown compromise
89%
of SOC job postings requiring threat hunting require MITRE ATT&CK knowledge

⚡ Start hunting this week

  1. Enable PowerShell Script Block Logging across all Windows systems today — this single step adds more hunting capability than any other single configuration change. Group Policy path: Computer Configuration → Administrative Templates → Windows Components → Windows PowerShell → Turn on PowerShell Script Block Logging. This populates Event ID 4104 with decoded PowerShell content in your SIEM immediately.
  2. Run Hunt H1 (Office spawning shells) right now — open your SIEM, paste the SPL or KQL query from Section 6, and run it against the last 30 days. If it returns results, you have findings to investigate. If it returns nothing, you have confirmed this technique is not currently active in your environment and established a baseline. Either outcome is valuable.
  3. Build your ATT&CK Navigator coverage map — go to attack.mitre.org/resources/navigator, create a new layer, colour your existing detection rules green, and identify the red gaps. This visualisation immediately shows you where your hunting programme should focus.
  4. Understand the SIEM that powers your hunts — threat hunting runs on top of SIEM telemetry. The better your SIEM is configured, the more effective your hunts are. SIEM guide →
  5. Connect hunting to incident response — when a hunt finds something, it becomes an incident. Your IR plan should have a specific intake path for hunt-generated findings that may indicate a compromise predating any alert. Incident response plan →
Frequently asked questions
What is threat hunting in cybersecurity?

Threat hunting is the proactive, human-led search through security telemetry for evidence of adversary activity that automated detection systems (SIEM rules, EDR signatures) have not caught. A threat hunter forms a specific hypothesis — "an attacker may be using this technique in our environment" — then searches through logs, EDR data, and network telemetry to confirm or refute it. Unlike alert monitoring (which is reactive — wait for a rule to fire, then investigate), threat hunting is proactive — the analyst initiates the investigation based on knowledge of attacker techniques and threat intelligence, not on an automated alert.

What skills do you need for threat hunting?

Effective threat hunters need: deep knowledge of the MITRE ATT&CK framework (understanding attacker techniques and what evidence they leave); strong query skills in at least one SIEM language (Splunk SPL or Microsoft KQL are most in-demand); understanding of Windows, Linux, and network log formats; baseline familiarity with attacker tools and techniques (what does a Mimikatz execution look like in process logs?); ability to distinguish anomalies from normal behaviour (requires knowing what normal looks like for the specific environment); and threat intelligence awareness — understanding what current threat actors are actually doing. Most experienced SOC analysts can develop threat hunting skills with 6–12 months of focused practice on top of their existing triage skills.

What is a threat hunting hypothesis?

A threat hunting hypothesis is a testable statement about what an attacker might be doing in your environment and what evidence of that activity would look like in your data. A good hypothesis has four components: what adversary technique you are looking for (linked to an ATT&CK technique), why you believe it might be present (threat intelligence, coverage gap, or baseline anomaly), what observable evidence the technique would leave in specific log sources, and what query or investigation approach you will use to find it. Hypotheses prevent hunts from becoming aimless data exploration and ensure every hunt produces a definitive outcome — either the technique is present or it is not, which is meaningful in both cases.

What is the difference between threat hunting and penetration testing?

Penetration testing is an offensive exercise — a tester attempts to exploit vulnerabilities in your environment, acting as an attacker, to identify security gaps. Threat hunting is a defensive exercise — an analyst searches through your telemetry for evidence of real attackers who may already be present. Both look at attacker techniques, but from opposite sides: penetration testers simulate attacks to find vulnerabilities; threat hunters search for evidence of real attacks to find active adversaries. They are complementary — penetration test findings often generate excellent hypotheses for the next threat hunting cycle (if a tester successfully used a technique, hunt for evidence of real attackers using the same technique).

Do you need a dedicated threat hunting team?

No — a dedicated team is the mature state of a hunting programme, not the starting point. Organisations with even a single SOC analyst can run effective threat hunts by dedicating structured time to proactive hunting (one day per week is a common starting point). The key is discipline — hunting time must be protected from alert triage work, or it will always be displaced by reactive work. Even running the 8 hunts in this article quarterly against your environment adds significant detection capability over pure alert monitoring. A dedicated hunting team is justified when the organisation is large enough that a single analyst cannot cover the environment's complexity within a reasonable hunt cadence.

What happens when a threat hunt finds something?

When a hunt finds confirmed malicious activity, it becomes an incident and is handed to the incident response process — following the same IR plan as any other security incident. The hunt output gives the IR team a significant head start: the attacker's techniques (ATT&CK technique IDs), the affected systems and accounts, the timeline of activity, and initial evidence. This typically accelerates IR significantly compared to starting an investigation from scratch on a fresh SIEM alert. After the incident is resolved, the hunt findings should be converted into new automated detection rules so future instances of the same technique are caught automatically rather than requiring a hunter to find them manually.

About the author Written by the HOC Team at Hackers Online Club — a cybersecurity community trusted by threat hunters, SOC analysts, blue team engineers, and security students since 2010. 15+ years of practical cybersecurity guides, SIEM tutorials, and enterprise security resources. Learn more about HOC →