

On a Tuesday afternoon in March 2024, a hospital network's security team detected ransomware detonating across fourteen servers. Within the first six minutes, a responder connected a laptop directly to the primary infected domain controller and ran a script that flushed the Windows Event Log.
They thought they were helping — "clearing the noise." What they actually did was destroy the primary record of how the attacker gained initial access, which accounts they used, and what they accessed before deploying the ransomware. The forensic investigation that followed cost six weeks instead of six days, and the question of whether patient data was exfiltrated before encryption — a notification obligation question worth millions in regulatory exposure — could never be definitively answered.
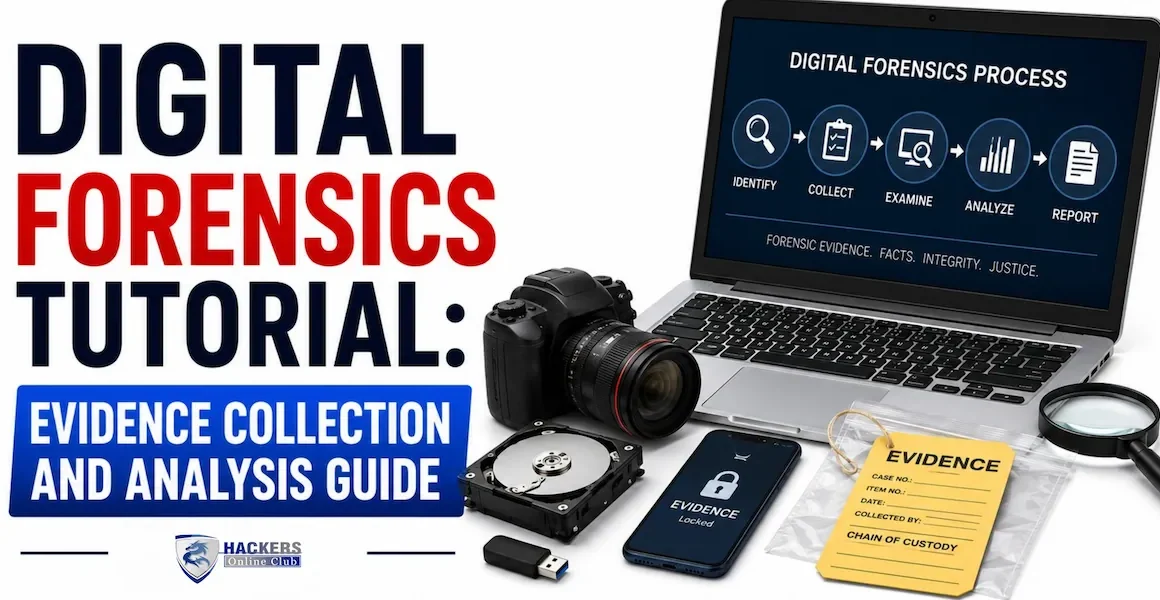
Digital forensics is the discipline that preserves, collects, and analyses digital evidence from computers, networks, and storage media to reconstruct what happened during a security incident. Done correctly, it answers the questions every organisation needs answered after a breach: What was the initial entry point? Which accounts were compromised? What data did the attacker access or exfiltrate? What systems were affected? When did each event occur? Done incorrectly — or skipped entirely — those questions may never be answerable.
This guide covers the complete digital forensics process for incident responders and security analysts: the evidence types and their volatility, chain of custody procedures, disk imaging with FTK Imager and dd, memory acquisition and Volatility analysis, Windows artefact locations and what they contain, log analysis techniques, and the free open-source toolchain used by professional DFIR teams.
- DFIR fundamentals — what digital forensics is and is not
- Evidence types and order of volatility
- Chain of custody — the legal foundation
- Disk imaging — acquiring a forensic copy
- Memory forensics with Volatility
- Windows forensic artefacts — what survives and where
- Log analysis for incident reconstruction
- Autopsy — full disk analysis walkthrough
- Network forensics — PCAP analysis
- DFIR toolchain — the complete free toolkit
- Frequently asked questions
Digital forensics is the application of scientific methods to the preservation, collection, examination, and analysis of digital evidence. The goal is to produce findings that are accurate, repeatable, and defensible — meaning another qualified examiner working with the same evidence should reach the same conclusions, and the methodology must withstand scrutiny in legal proceedings.
1. Preservation — Evidence must be preserved in its original state. Any change to the original evidence — even reading a file, which updates its access timestamp — must be documented and minimised. This is why forensic examiners work from bit-for-bit copies (images) rather than the original media, and why write blockers are used during acquisition.
2. Integrity — The authenticity and completeness of evidence must be verifiable. Cryptographic hash values (MD5, SHA-256) are computed before and after any evidence handling operation. If the hashes match, the evidence has not been altered. If they do not match, the evidence has been tampered with or corrupted.
3. Chain of custody — A complete, unbroken record must exist of every person who had access to the evidence, what they did with it, and when. This chain documents that evidence was not altered or tampered with between collection and presentation.
4. Documentation — Every action taken during the investigation must be documented contemporaneously — what was done, when, by whom, and what was found. Forensic work that cannot be reproduced from its documentation has limited evidentiary value.
Different types of digital evidence have vastly different lifespans. RAM contents vanish when power is removed — typically within seconds to minutes. Log files survive for days to years depending on retention policy. Understanding volatility determines the collection order: most volatile first, least volatile last. RFC 3227 (Guidelines for Evidence Collection and Archiving) defines this order and remains the field standard.
Chain of custody is the documented, unbroken record of who had control of evidence, when, and what they did with it. Its purpose is to prove that evidence has not been altered or tampered with between collection and presentation — in court, in a regulatory investigation, or in an insurance claim. A broken chain of custody can make otherwise solid evidence inadmissible.
| Field | What to record | Example |
|---|---|---|
| Case number | Unique identifier for the investigation | IR-2026-0047 |
| Evidence item number | Sequential item ID within the case | E-001 (RAM image), E-002 (disk image) |
| Date and time collected | ISO 8601 format, note timezone and offset | 2026-07-15T14:32:17+0000 (UTC) |
| Collected by | Full name, role, and badge/employee ID | Jane Smith, Senior DFIR Analyst, ID 4821 |
| Collection location | Physical location and system identifier | Server Room B, Rack 3, FINANCEDC01 (192.168.1.5) |
| System description | Make, model, serial number, OS | Dell PowerEdge R750, SN: CN0K4M7X, Windows Server 2022 |
| Evidence description | What was collected and how | 16GB RAM image acquired using WinPmem, saved as IR-2026-0047-E001.raw |
| Hash values | MD5 and SHA-256 of the acquired image | MD5: a3f8... SHA-256: 4d92... |
| Storage location | Where evidence is physically stored | Encrypted SSD in Evidence Locker 4, Key held by IR Lead |
| Transfers | Every time evidence changes hands — who gave it, who received it, when | 2026-07-15 16:00 — Transferred by Jane Smith to John Lee (Legal) for review |
- Hard drives, USB drives, and laptops that are collected as physical evidence must be stored in anti-static bags with tamper-evident seals. Write the evidence item number, date, and your initials across the seal.
- Disk images are typically stored on encrypted storage media (VeraCrypt or BitLocker encrypted drives). The encryption key is held by the IR lead and documented in the case file.
- Evidence should be stored in a locked location with access limited to authorised personnel. Document every entry in an access log.
- Create at least two copies of every forensic image — a primary working copy for analysis and a backup archive copy that is never used for analysis. If your working copy is corrupted, the archive preserves the evidence.
Timestamp accuracy is critical in forensic timelines. Always note the difference between system time and actual UTC time — a system with an incorrectly set clock, or a system in a different timezone, will generate event log timestamps that appear incorrect when correlated with other systems. Document the system time vs. UTC delta at collection time.
A forensic disk image is a bit-for-bit copy of a storage device — every sector, including unallocated space, deleted file remnants, and slack space. This is different from a file-level backup, which copies only files the operating system considers present. Forensic images capture deleted files, file fragments, and data left in previously used disk sectors that a file-level backup would miss entirely.
FTK Imager Lite (the portable version) runs directly from a USB drive with no installation. Download from exterro.com/ftk-imager. Always run from external media — installing software on the target system modifies evidence.
The dd command is available on every Linux and macOS system and produces raw forensic images. Combine with dcfldd or dc3dd for progress display and built-in hashing:
When physical access to the target system is not possible — remote servers, cloud instances — image over the network using netcat or SSH:
Memory forensics is the analysis of a RAM dump to recover evidence of running processes, network connections, loaded code, injected shellcode, and credentials that exist only in memory. It is essential for detecting fileless malware — malware that executes entirely in RAM and writes nothing to disk, making it invisible to disk-based forensics and most antivirus products.
Windows leaves a rich trail of forensic artefacts — records of program execution, file access, user activity, and system changes that persist long after the events themselves. Knowing where these artefacts live and what they contain is the core knowledge that separates effective Windows forensic analysts from those who only look at obvious places.
| Artefact | Location | What it tells you |
|---|---|---|
| Prefetch files | C:\Windows\Prefetch\*.pf | Programs that were executed — filename, run count, last run time, files and directories accessed on each run. Exists even if the original executable was deleted. Disabled on servers by default. |
| ShimCache (AppCompat) | HKLM\SYSTEM\CurrentControlSet\Control\Session Manager\AppCompatCache | Every executable that ran on the system — file path, size, last modified timestamp. One of the most reliable execution artefacts. Parse with ShimCacheParser.py. |
| AmCache | C:\Windows\AppCompat\Programs\Amcache.hve | SHA-1 hash of every executed program, install time, first execution time, publisher info. The SHA-1 hash allows VirusTotal lookups even if the file was deleted. |
| BAM/DAM (Background Activity Moderator) | HKLM\SYSTEM\CurrentControlSet\Services\bam\State\UserSettings | Full path of every executable run per user, with timestamp of last execution. Very reliable on Windows 10+. |
| UserAssist | HKCU\Software\Microsoft\Windows\CurrentVersion\Explorer\UserAssist | GUI programs launched via Explorer — run count, last run time. ROT13-encoded. Useful for user activity analysis. |
| Jump Lists | C:\Users\[user]\AppData\Roaming\Microsoft\Windows\Recent\AutomaticDestinations | Recently opened files per application — contains file paths and access timestamps for files that no longer exist on the filesystem. |
| SRUM (System Resource Usage Monitor) | C:\Windows\System32\sru\SRUDB.dat | Network usage per application (bytes sent/received), CPU and RAM usage per process. Up to 30-60 days of historical data. Excellent for detecting data exfiltration by process. |
| Artefact | Location | What it tells you |
|---|---|---|
| SAM database | C:\Windows\System32\config\SAM | Local user accounts and NTLM password hashes. Extract with samdump2 or Volatility. Requires SYSTEM hive for decryption key. |
| NTDS.dit | C:\Windows\NTDS\NTDS.dit (Domain Controllers only) | Active Directory database — all domain accounts, password hashes, group memberships. The crown jewel of credential data. Extract with ntdsutil, impacket-secretsdump, or DSInternals. |
| Windows Event Log — Security | C:\Windows\System32\winevt\Logs\Security.evtx | Authentication events (4624/4625), account management (4720/4732), process creation (4688), privilege use. The primary authentication audit trail. |
| Logon sessions (memory) | LSASS process memory | Currently logged on users, their NTLM hashes, and Kerberos tickets. Extracted with Mimikatz or Volatility's hashdump/lsadump plugins. |
Eric Zimmerman (a former FBI DFIR examiner) has released a suite of free Windows forensic tools that parse virtually every artefact type listed above. Download the full suite from ericzimmerman.github.io — it includes MFTECmd, PECmd (Prefetch), AmcacheParser, ShimCacheParser, SBECmd (ShimCache), RECmd (Registry), EvtxECmd (Event Logs), and Timeline Explorer for merging all outputs into a single timeline.
Windows event logs are the primary record of security-relevant activity on a Windows system. Knowing which Event IDs to look for and what they mean allows an investigator to reconstruct an attack timeline from authentication, to execution, to lateral movement, to persistence — entirely from log data.
| Event ID | Log | What it records | Investigation value |
|---|---|---|---|
| 4624 | Security | Successful logon — includes LogonType, account name, source IP, workstation | Track attacker movement — which accounts logged in from which IPs, LogonType 3=network, 10=remote interactive |
| 4625 | Security | Failed logon — same fields as 4624 plus failure reason | Brute force detection, password spraying, invalid account usage |
| 4648 | Security | Logon with explicit credentials (runas) — shows both the running account and target account | Lateral movement — attacker using stolen credentials to authenticate as different account |
| 4688 | Security | Process creation — requires audit policy to be enabled, includes command line if configured | Execution tracking — every process run with its command line arguments |
| 4698 | Security | Scheduled task created | Persistence — every new scheduled task creation |
| 4720 | Security | User account created | Persistence — attacker creating backdoor accounts |
| 4732 | Security | Member added to security-enabled local group | Privilege escalation — adding account to Administrators group |
| 4776 | Security | NTLM authentication — source workstation and account | Pass-the-hash detection — NTLM auth from unexpected sources |
| 4768 | Security (DC) | Kerberos TGT requested | AS-REP Roasting detection, Golden Ticket detection |
| 4769 | Security (DC) | Kerberos service ticket requested | Kerberoasting — unusual service ticket requests for SPNs |
| 7045 | System | New service installed — service name, path, account | Persistence and lateral movement (PsExec installs PSEXESVC service) |
| 1102 | Security | Security audit log cleared | Anti-forensics — attacker covering tracks. No false positives expected. |
| 4104 | PowerShell | Script block logged — full decoded PowerShell script content | Execution — captures PowerShell malware content including decoded payloads |
| 1 | Sysmon | Process creation with full command line, hashes, parent info | Most comprehensive execution record available — requires Sysmon deployment |
| 3 | Sysmon | Network connection — process, source, destination, port | C2 detection — which process made which outbound connection |
| 10 | Sysmon | Process access — one process opening another's memory | Credential dumping — LSASS being accessed by non-system processes |
Autopsy is a free, open-source digital forensics platform with a graphical interface built on The Sleuth Kit. It is the most widely used free forensics GUI, used by law enforcement, corporate DFIR teams, and training courses globally. It automates many artefact extraction tasks that would otherwise require running individual tools manually.
Network packet captures (PCAPs) record every byte of network traffic passing through a network point. They are the ground truth for reconstructing attacker C2 communications, data exfiltration, and lateral movement over the network. Wireshark is the standard free tool; NetworkMiner extracts files and credentials from PCAPs automatically.
NetworkMiner (netresec.com/networkminer — free version available) parses a PCAP file and automatically extracts: files transferred over HTTP/FTP/SMB, credentials sent in cleartext, X.509 certificates from TLS sessions, host operating system fingerprints, and reassembled message streams. Load a PCAP and within minutes you have a directory of all files that transited the network during the capture.
| Tool | Category | Platform | What it does | Get it |
|---|---|---|---|---|
| FTK Imager | Disk imaging | Windows | Forensic disk imaging with hash verification, E01 and raw output, preview before imaging | exterro.com/ftk-imager |
| dc3dd / dcfldd | Disk imaging | Linux/Mac | dd replacement with hashing, progress display, and split output | apt install dc3dd |
| WinPmem | Memory acquisition | Windows | RAM image acquisition — portable, no install needed | github.com/Velocidex/WinPmem |
| LiME | Memory acquisition | Linux | Kernel module for full Linux RAM image capture | github.com/504ensicsLabs/LiME |
| Volatility 3 | Memory analysis | Win/Linux/Mac | Process analysis, network connections, malfind, registry extraction from RAM dumps | volatilityfoundation.org |
| Autopsy | Disk analysis GUI | Windows | Full forensic GUI — timeline, artefact extraction, deleted file recovery, reporting | autopsy.com |
| The Sleuth Kit (TSK) | Disk analysis CLI | Linux/Mac | Command-line disk analysis — fls, istat, mmls, sorter | sleuthkit.org |
| Eric Zimmerman Tools | Windows artefacts | Windows | MFTECmd, PECmd, AmcacheParser, EvtxECmd, Timeline Explorer — complete Windows artefact suite | ericzimmerman.github.io |
| Wireshark / tshark | Network analysis | Win/Linux/Mac | PCAP capture and analysis with display filters | wireshark.org |
| NetworkMiner | Network analysis | Windows | Automatic file/credential extraction from PCAP files | netresec.com/networkminer |
| KAPE (Kroll Artifact Parser) | Triage / collection | Windows | Rapid artefact collection from live systems — collects Prefetch, event logs, registry, browser history in minutes | github.com/EricZimmerman/KapeFiles |
| Velociraptor | Enterprise DFIR | Win/Linux/Mac | Endpoint telemetry collection, remote forensic acquisition, threat hunting at scale | velocidex.com |
| Plaso / log2timeline | Timeline | Linux | Creates super-timeline from multiple artefact sources — merges all timestamps into chronological view | github.com/log2timeline/plaso |
| Hayabusa | Event log analysis | Win/Linux | Fast Windows event log analysis using Sigma rules — generates timeline and ATT&CK-mapped findings | github.com/Yamato-Security/hayabusa |
| REMnux | Malware analysis | Linux (VM) | Complete malware analysis Linux distribution — static/dynamic analysis tools pre-installed | remnux.org |
⚡ Getting started with digital forensics
- Set up a practice environment this week — download a vulnerable VM image from blueteamlabs.online or cyberdefenders.org (both free). These provide pre-built forensic challenge environments with disk images, memory dumps, and PCAP files to practise on without needing a real incident. Install Autopsy, Volatility 3, and Eric Zimmerman's tools on your analysis workstation and work through a challenge end-to-end.
- Build your forensic USB toolkit — download WinPmem, FTK Imager Lite, KAPE with default collection targets, and the Eric Zimmerman tool suite onto a dedicated USB drive. Test that every tool runs correctly. Label the drive and keep it accessible. You will regret not having it ready the first time you need to respond to an incident quickly.
- Connect forensics to your incident response plan — your IR plan should include explicit forensic collection steps: who collects RAM, who images the disk, who exports the logs, and in what order. Evidence collection decisions made in the first 15 minutes of an incident determine what you can and cannot prove for the entire investigation. Incident response plan guide →
- Learn the Windows artefact landscape — the most valuable investment for Windows DFIR is memorising the key artefact locations (Prefetch, ShimCache, AmCache, Event Log IDs) and what each one tells you. Eric Zimmerman's blog (binaryforay.blogspot.com) is the definitive reference and is free.
- Understand how forensics fits the full security stack — forensics answers the "what happened" question after detection. The complementary skills are threat hunting (proactive search before detection), SIEM (the detection layer), and MITRE ATT&CK (the framework that maps what you find to known attacker techniques). Threat hunting → | MITRE ATT&CK →
Digital forensics is the discipline of preserving, collecting, and analysing digital evidence from computers, networks, and storage devices to reconstruct what happened during a security incident. It applies scientific methods — hash verification, chain of custody documentation, write-blocking — to ensure findings are accurate, reproducible, and legally defensible. In cybersecurity, it is most commonly applied during incident response (determining how an attacker gained access, what they did, and what they stole), insider threat investigations, and legal proceedings. The discipline is also called DFIR — Digital Forensics and Incident Response — reflecting how frequently forensics and IR are performed together.
Order of volatility describes how quickly different types of digital evidence are lost — and therefore the priority order for evidence collection. The most volatile evidence (RAM contents, network connections, running processes) must be collected first because it disappears when the system is powered off or the network connection is terminated. Less volatile evidence (disk contents, log files) can wait longer but may be overwritten as the system continues running. The standard order per RFC 3227: (1) RAM, (2) network state and connections, (3) running processes, (4) disk image, (5) log files. The critical rule: always collect RAM before powering off or rebooting a compromised system.
A forensic disk image is a bit-for-bit copy of every sector on a storage device — including unallocated space, deleted file fragments, and slack space that a normal file-level backup would miss. It is different from a backup, which copies only files the operating system considers present. Forensic images are created with tools like FTK Imager or dd, verified with cryptographic hashes (MD5, SHA-256) to confirm they are exact copies, and all analysis is performed on the image rather than the original device — preserving the original evidence unchanged. Common formats are E01 (Expert Witness Format, supports compression and metadata) and raw/dd (simple, maximum compatibility).
Memory forensics is the analysis of a RAM dump — a snapshot of a system's memory at a point in time — to recover evidence that exists only in memory. This includes: running processes (including malicious ones), active network connections, encryption keys, credentials cached in memory, injected shellcode in legitimate processes, and command history. Memory forensics is critical because fileless malware — malware that executes entirely in RAM without writing to disk — is invisible to disk-based forensics and most antivirus products. Volatility 3 is the standard free tool for memory analysis. RAM must be captured from a live running system before the system is powered off.
Chain of custody is the documented, unbroken record of every person who had access to evidence, when, and what they did with it — from the moment of collection through to presentation. Its purpose is to prove evidence was not altered or tampered with at any point. A broken chain of custody — a gap in documentation, evidence that changed hands without being recorded, or a period where evidence location is unknown — can make otherwise solid evidence inadmissible in legal proceedings. Chain of custody documentation must include: evidence item description, collection date and time, collector identity, hash values, storage location, and a log of every transfer between individuals.
Professional DFIR teams use a predominantly free toolchain: FTK Imager Lite for forensic disk imaging, WinPmem or DumpIt for Windows RAM acquisition, LiME for Linux RAM acquisition, Volatility 3 for memory analysis, Autopsy for disk analysis with a graphical interface, Eric Zimmerman's tools (MFTECmd, PECmd, AmcacheParser, EvtxECmd, Timeline Explorer) for Windows artefact parsing, Wireshark and tshark for PCAP analysis, NetworkMiner for automatic file extraction from network captures, KAPE for rapid live triage collection, and Hayabusa for Sigma-based Windows event log analysis. The complete professional toolkit is available at zero cost — the investment required is time learning how to use each tool effectively.